Changes in PRIMAP-hist v2.7_final compared to v2.6.1_final for Lithuania
2025-09-11
Johannes Gütschow
Change analysis for Lithuania for PRIMAP-hist v2.7_final compared to v2.6.1_final
Overview over emissions by sector and gas
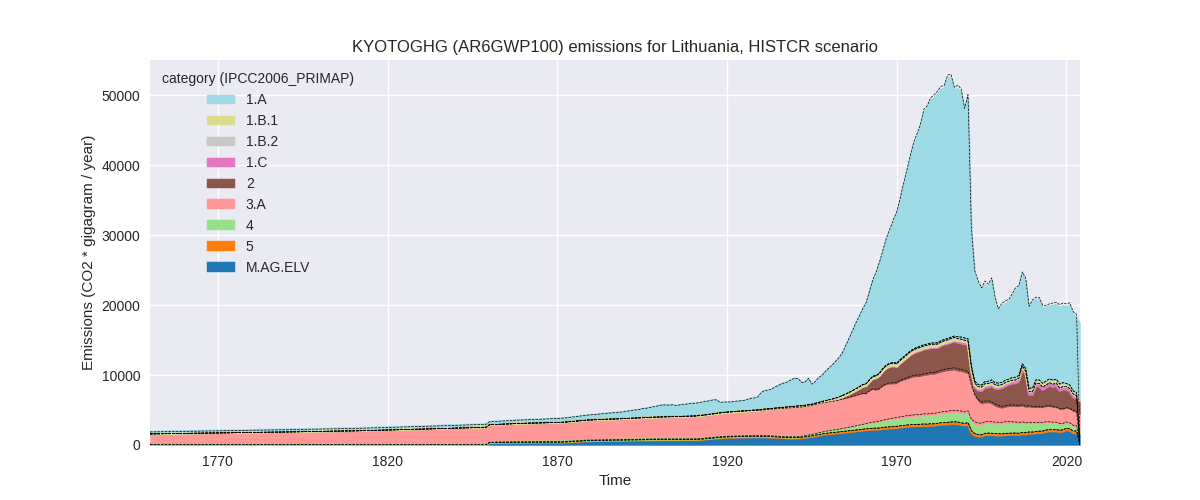
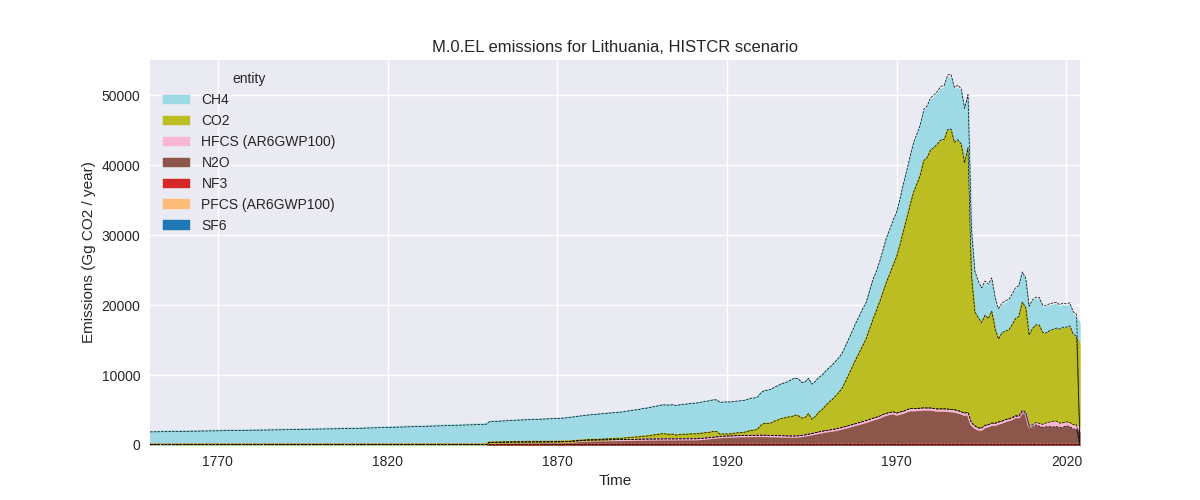
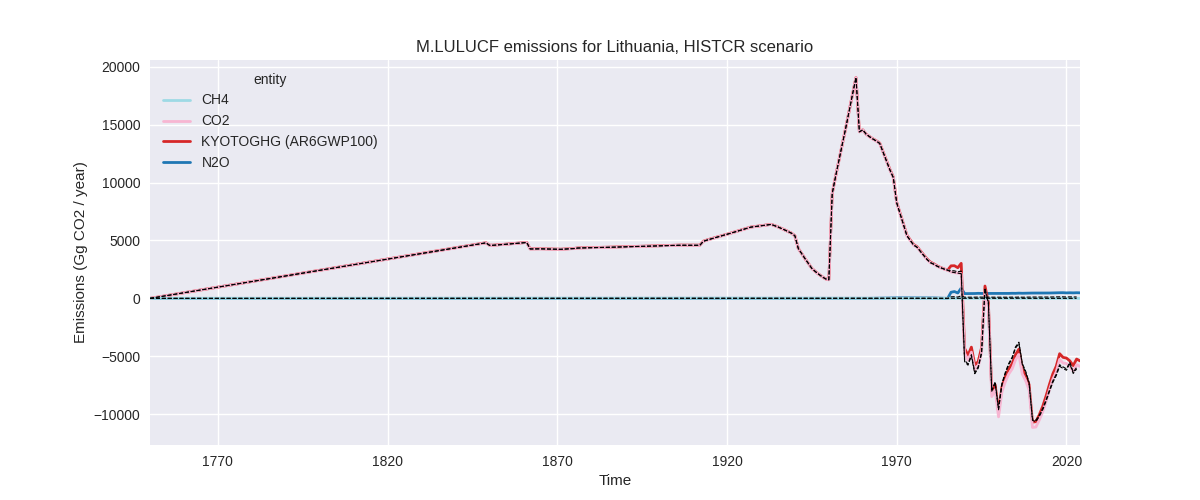
The following figures show the aggregate national total emissions excluding LULUCF AR6GWP100 for the country reported priority scenario. The dotted linesshow the v2.6.1_final data.
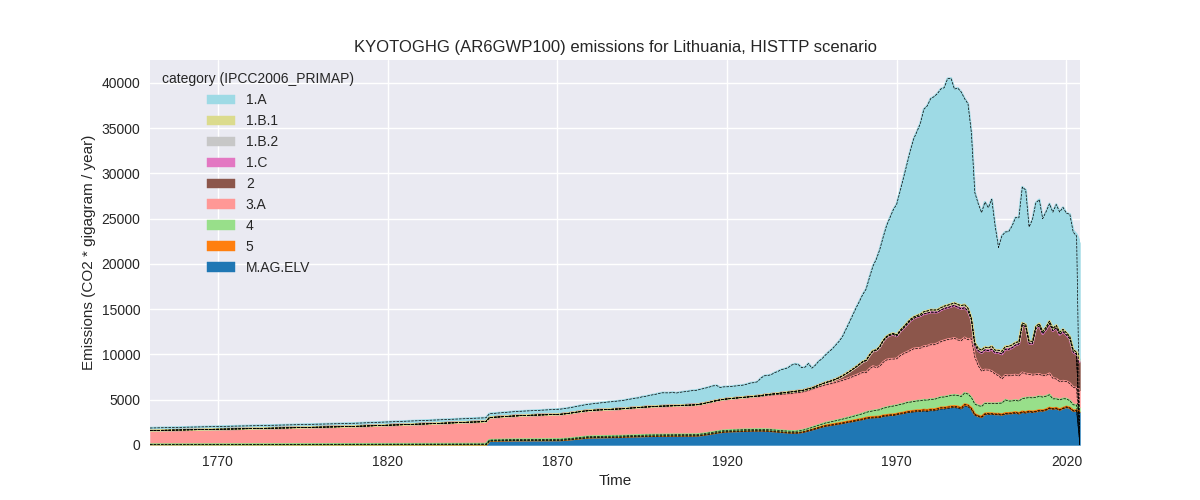
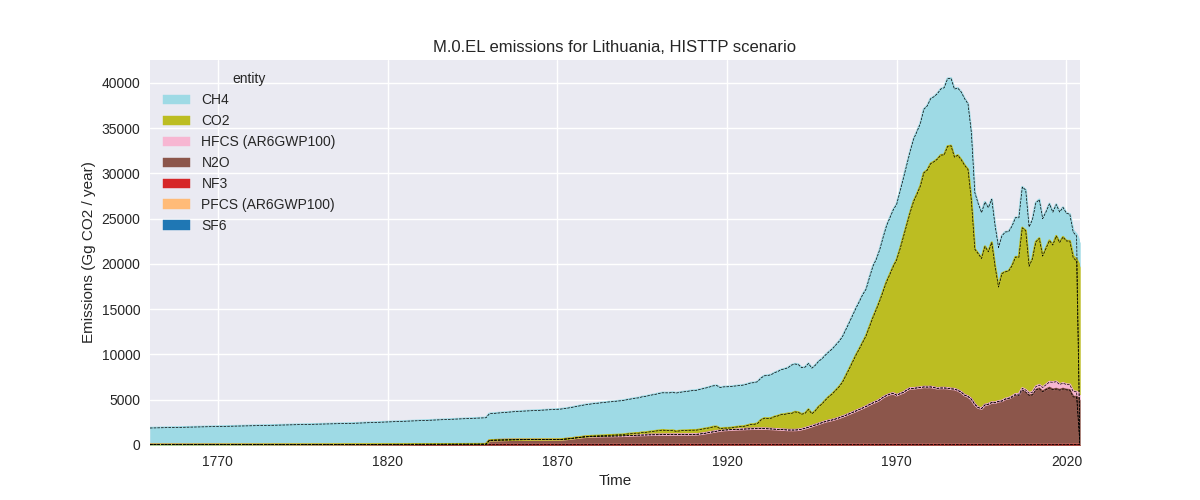
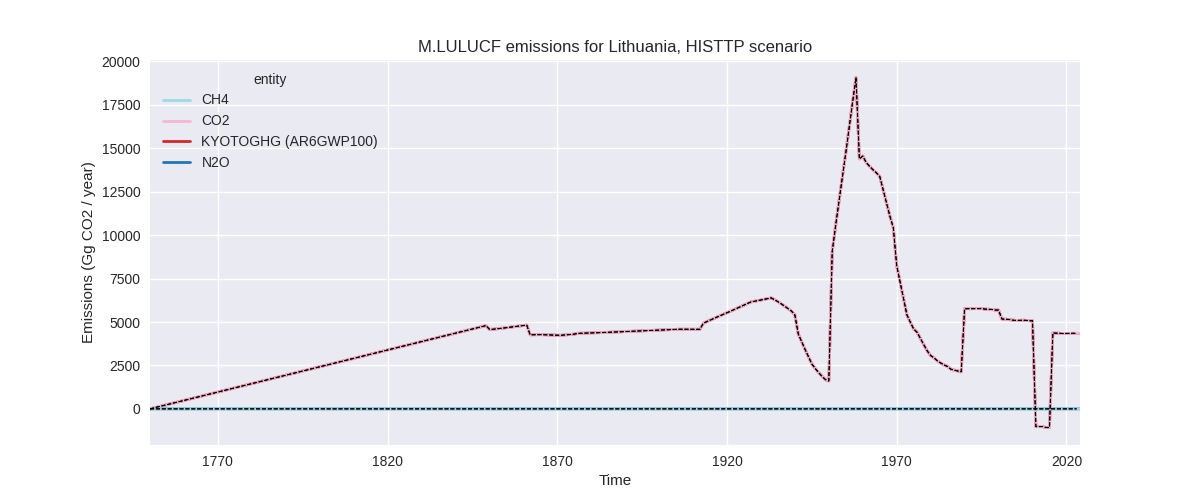
The following figures show the aggregate national total emissions excluding LULUCF AR6GWP100 for the third party priority scenario. The dotted linesshow the v2.6.1_final data.
Overview over changes
In the country reported priority scenario we have the following changes for aggregate Kyoto GHG and national total emissions excluding LULUCF (M.0.EL):
- Emissions in 2023 have changed by -3.6%% (-666.23 Gg CO2 / year)
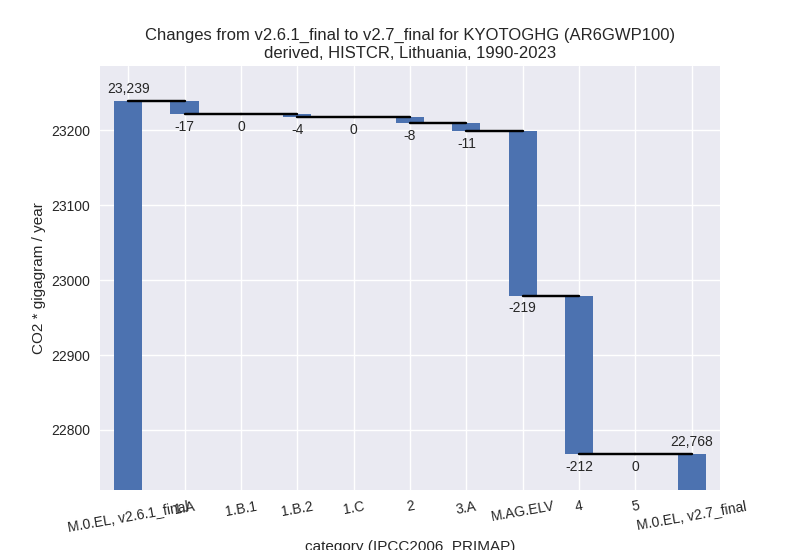
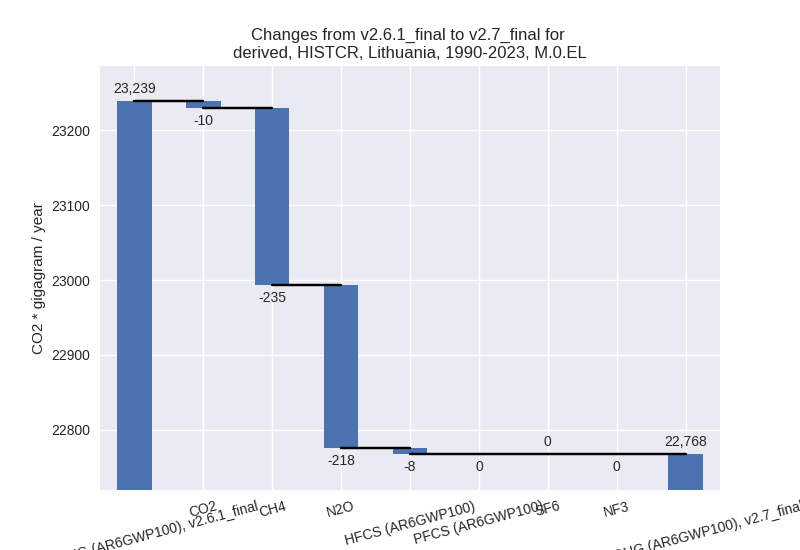
- Emissions in 1990-2023 have changed by -2.0%% (-470.94 Gg CO2 / year)
In the third party priority scenario we have the following changes for aggregate Kyoto GHG and national total emissions excluding LULUCF (M.0.EL):
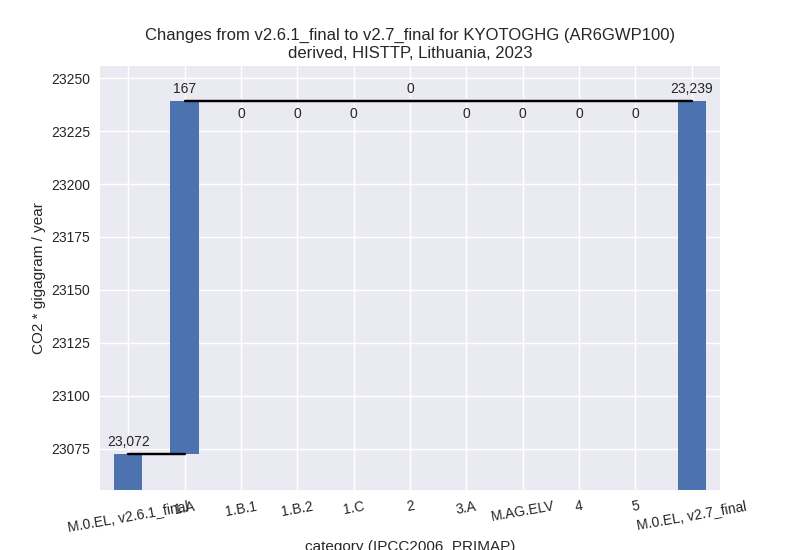
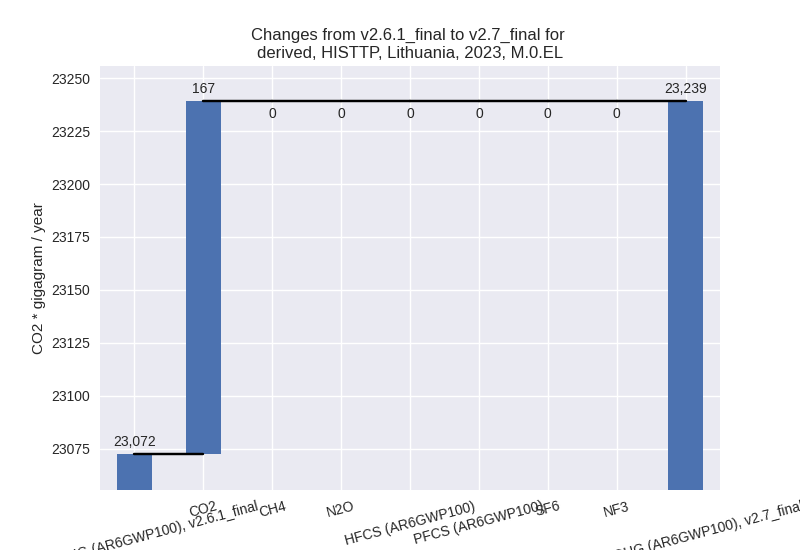
- Emissions in 2023 have changed by 0.7%% (166.71 Gg CO2 / year)
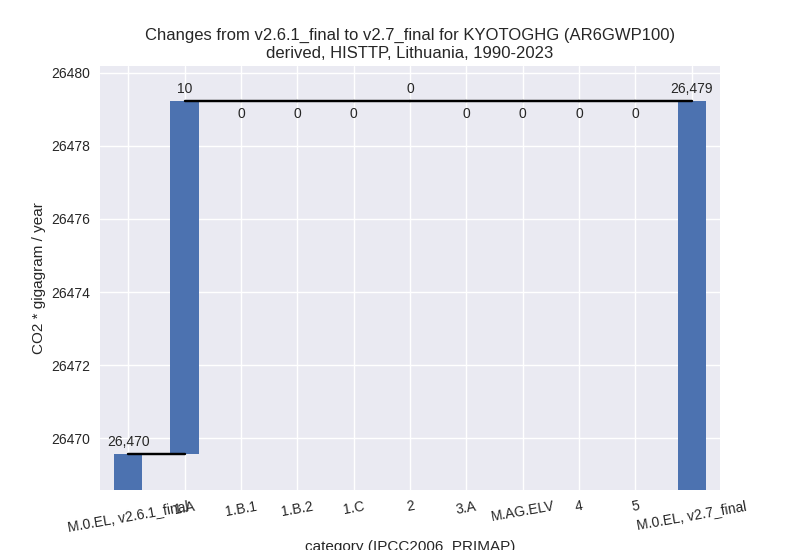
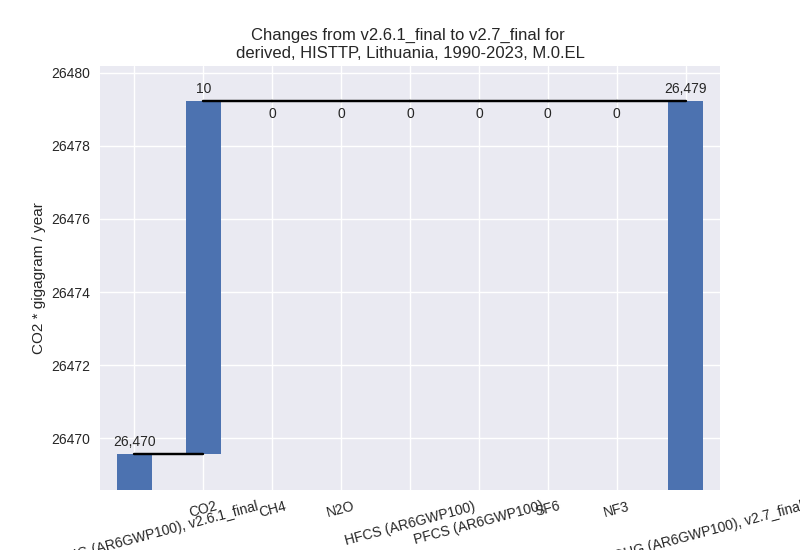
- Emissions in 1990-2023 have changed by 0.0%% (9.66 Gg CO2 / year)
Most important changes per scenario and time frame
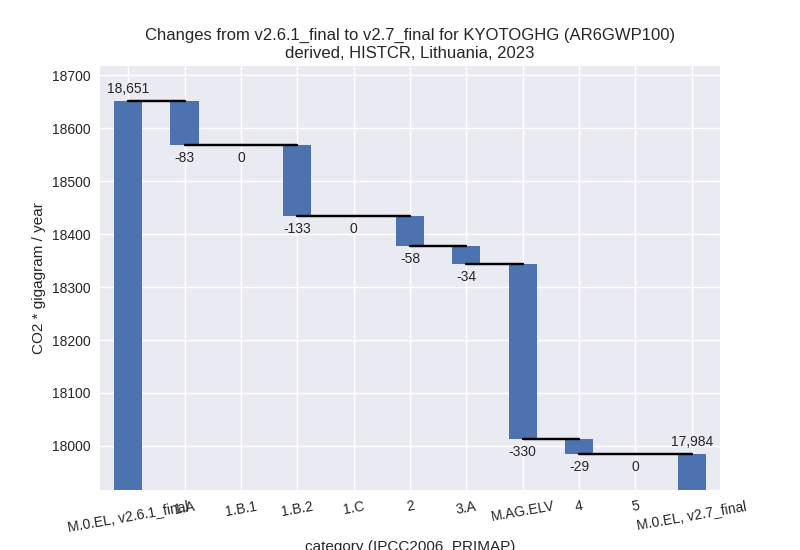
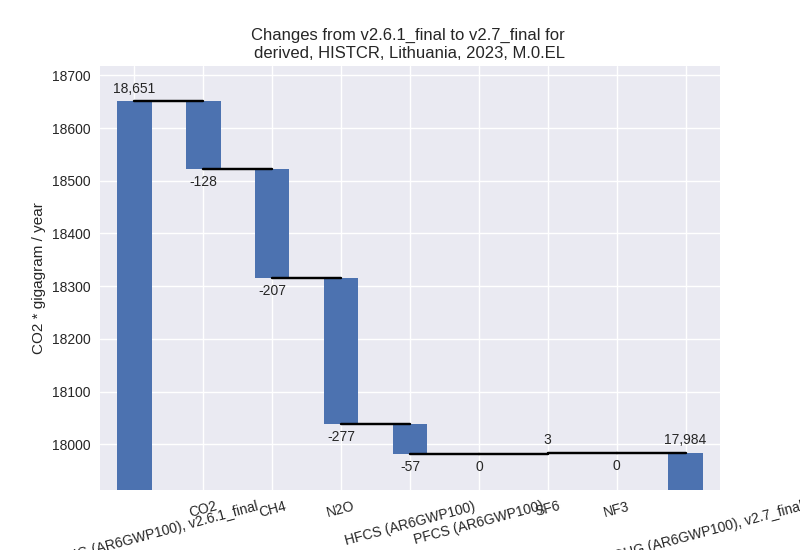
In the country reported priority scenario the following sector-gas combinations have the highest absolute impact on national total KyotoGHG (AR6GWP100) emissions in 2023 (top 5):
- 1: M.AG.ELV, N2O with -296.69 Gg CO2 / year (-15.5%)
- 2: 1.B.2, CH4 with -75.01 Gg CO2 / year (-40.6%)
- 3: 1.A, CH4 with -66.49 Gg CO2 / year (-32.5%)
- 4: 1.B.2, CO2 with -57.97 Gg CO2 / year (-22.7%)
- 5: 2, HFCS (AR6GWP100) with -57.16 Gg CO2 / year (-9.2%)
In the country reported priority scenario the following sector-gas combinations have the highest absolute impact on national total KyotoGHG (AR6GWP100) emissions in 1990-2023 (top 5):
- 1: M.AG.ELV, N2O with -217.53 Gg CO2 / year (-11.5%)
- 2: 4, CH4 with -211.83 Gg CO2 / year (-15.5%)
- 3: 1.A, CH4 with -11.73 Gg CO2 / year (-5.3%)
- 4: 3.A, CH4 with -9.48 Gg CO2 / year (-0.4%)
- 5: 2, HFCS (AR6GWP100) with -8.11 Gg CO2 / year (-3.0%)
In the third party priority scenario the following sector-gas combinations have the highest absolute impact on national total KyotoGHG (AR6GWP100) emissions in 2023 (top 5):
- 1: 1.A, CO2 with 166.69 Gg CO2 / year (1.3%)
- 2: 2, CO2 with 0.02 Gg CO2 / year (0.0%)
- 3: 1.A, CH4 with 0.00 Gg CO2 / year (0.0%)
- 4: 2, HFCS (AR6GWP100) with 0.00 Gg CO2 / year (0.0%)
- 5: 2, NF3 with 0.00 Gg CO2 / year (0.0%)
In the third party priority scenario the following sector-gas combinations have the highest absolute impact on national total KyotoGHG (AR6GWP100) emissions in 1990-2023 (top 5):
- 1: 1.A, CO2 with 9.66 Gg CO2 / year (0.1%)
- 2: 2, CO2 with 0.00 Gg CO2 / year (0.0%)
- 3: 1.A, CH4 with 0.00 Gg CO2 / year (0.0%)
- 4: 2, HFCS (AR6GWP100) with 0.00 Gg CO2 / year (0.0%)
- 5: 2, NF3 with 0.00 Gg CO2 / year (0.0%)
Notes on data changes
Here we list notes explaining important emissions changes for the country.
- Data from BTR1 has been replaced by data from the 2025 National
Inventory Submission. This leads to changes in several sectors and gases
which are small in terms of total emissions.
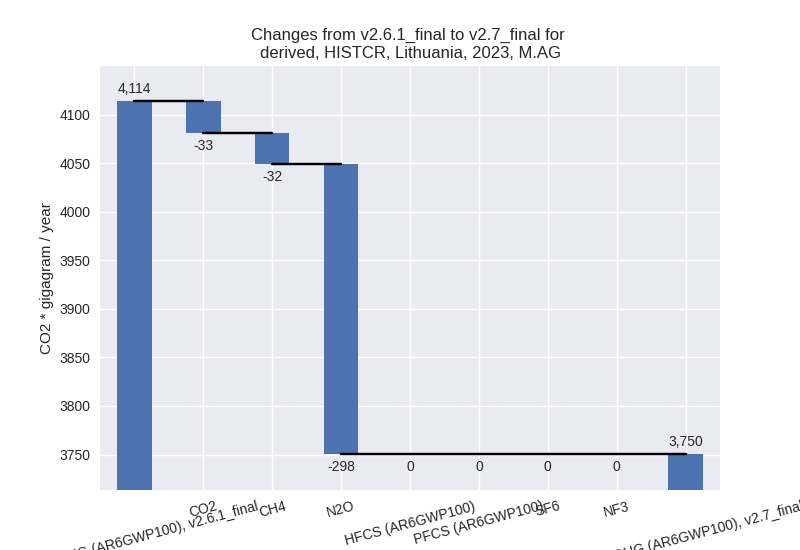
- The main change for 2023 and cumulative emissions is a reduction in N2O from M.AG.ELV which are due to updated activity data and a reduced emissions factor for cultivation of organic soils.
- Waste CH4 emissions are much lower for all years because of a much lower emissions factor for domestic wastewater.
- For 2023 CH4 from 1.B.2 is much lower because the CR emissions show a continuation of a steep downward trend not modeled in EDGAR emissions used for extrapolation in v2.6.1. For CO2 emissions are lower because an upward trend was not continued in 2023.
- CH4 from energy (1.A) is lower starting in 2013 mainly due to a lower emissions factor for residential biomass use.
- HFC emissions are lower for most years with an increasing difference for later years with reductions in several categories and for different individual HFCs.
- Changes in the TP scenario are very small and mainly come from the updated EI data for energy CO2.
Changes by sector and gas
For each scenario and time frame the changes are displayed for all individual sectors and all individual gases. In the sector plot we use aggregate Kyoto GHGs in AR6GWP100. In the gas plot we usenational total emissions without LULUCF.
country reported scenario
2023
1990-2023
third party scenario
2023
1990-2023
Detailed changes for the scenarios:
country reported scenario (HISTCR):
Most important changes per time frame
For 2023 the following sector-gas combinations have the highest absolute impact on national total KyotoGHG (AR6GWP100) emissions in 2023 (top 5):
- 1: M.AG.ELV, N2O with -296.69 Gg CO2 / year (-15.5%)
- 2: 1.B.2, CH4 with -75.01 Gg CO2 / year (-40.6%)
- 3: 1.A, CH4 with -66.49 Gg CO2 / year (-32.5%)
- 4: 1.B.2, CO2 with -57.97 Gg CO2 / year (-22.7%)
- 5: 2, HFCS (AR6GWP100) with -57.16 Gg CO2 / year (-9.2%)
For 1990-2023 the following sector-gas combinations have the highest absolute impact on national total KyotoGHG (AR6GWP100) emissions in 1990-2023 (top 5):
- 1: M.AG.ELV, N2O with -217.53 Gg CO2 / year (-11.5%)
- 2: 4, CH4 with -211.83 Gg CO2 / year (-15.5%)
- 3: 1.A, CH4 with -11.73 Gg CO2 / year (-5.3%)
- 4: 3.A, CH4 with -9.48 Gg CO2 / year (-0.4%)
- 5: 2, HFCS (AR6GWP100) with -8.11 Gg CO2 / year (-3.0%)
Changes in the main sectors for aggregate KyotoGHG (AR6GWP100) are
- 1: Total sectoral emissions in 2022 are 11655.33 Gg CO2 / year which is 62.9% of M.0.EL emissions. 2023 Emissions have changed by -1.9% (-216.01 Gg CO2 / year). 1990-2023 Emissions have changed by -0.2% (-21.29 Gg CO2 / year).
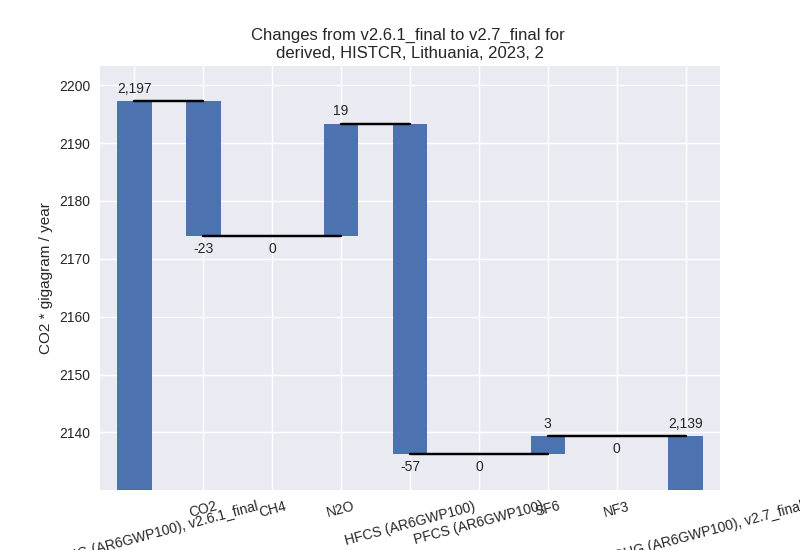
- 2: Total sectoral emissions in 2022 are 2333.74 Gg
CO2 / year which is 12.6% of M.0.EL emissions. 2023 Emissions have
changed by -2.6% (-57.90 Gg CO2 /
year). 1990-2023 Emissions have changed by -0.3% (-8.13 Gg CO2 / year). For 2023 the
changes per gas
are:
- M.AG: Total sectoral emissions in 2022 are 3838.37
Gg CO2 / year which is 20.7% of M.0.EL emissions. 2023 Emissions have
changed by -8.8% (-363.33 Gg CO2 /
year). 1990-2023 Emissions have changed by -4.9% (-229.81 Gg CO2 / year). For 2023
the changes per gas
are:
For 1990-2023 the changes per gas are: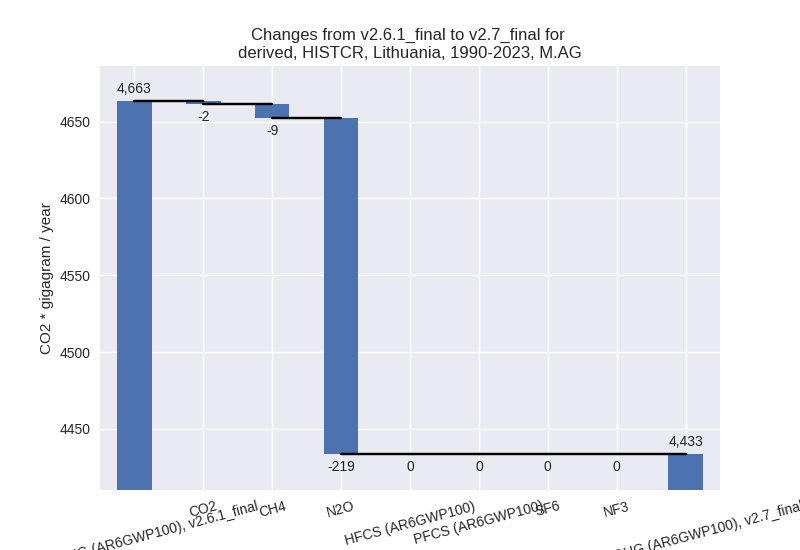
The changes come from the following subsectors:- 3.A: Total sectoral emissions in 2022 are 2097.36 Gg CO2 / year which is 54.6% of category M.AG emissions. 2023 Emissions have changed by -1.6% (-33.63 Gg CO2 / year). 1990-2023 Emissions have changed by -0.4% (-10.57 Gg CO2 / year).
- M.AG.ELV: Total sectoral emissions in 2022 are
1741.01 Gg CO2 / year which is 45.4% of category M.AG emissions. 2023
Emissions have changed by -16.4%
(-329.71 Gg CO2 / year). 1990-2023 Emissions have changed by -11.3% (-219.24 Gg CO2 / year). For 2023
the changes per gas
are:
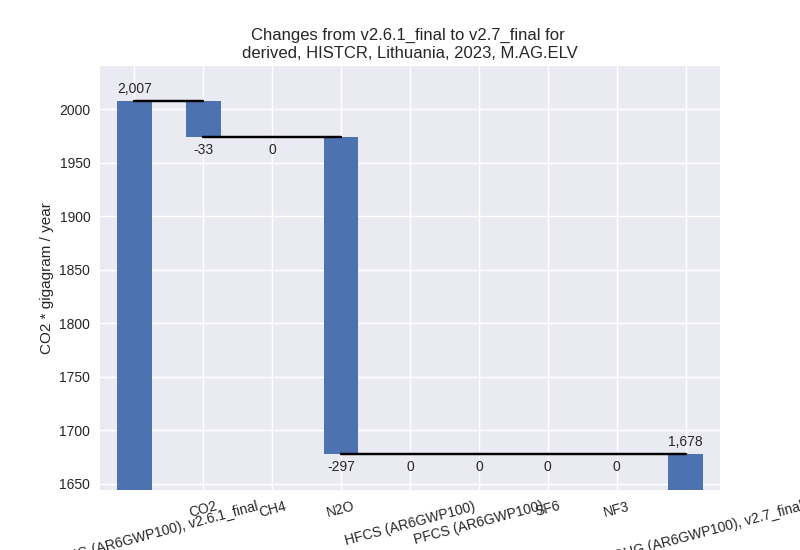
For 1990-2023 the changes per gas are: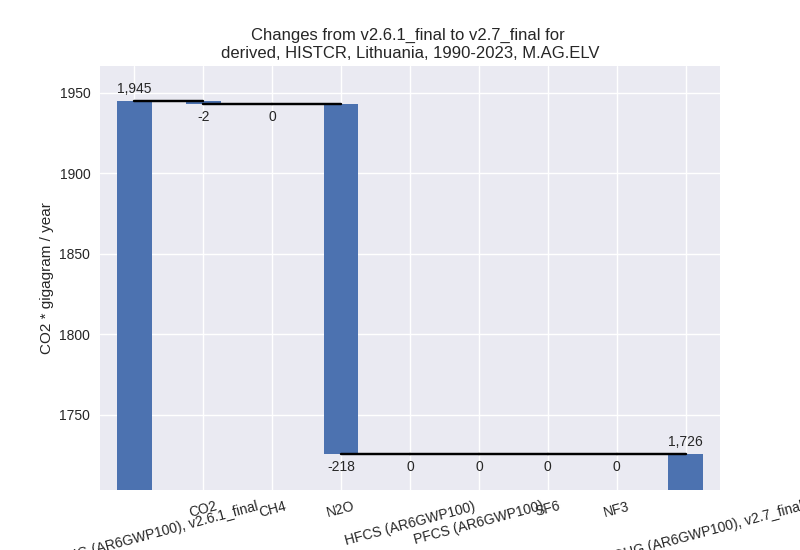
There is no subsector information available in PRIMAP-hist.
- 4: Total sectoral emissions in 2022 are 705.16 Gg
CO2 / year which is 3.8% of M.0.EL emissions. 2023 Emissions have
changed by -3.9% (-28.98 Gg CO2 /
year). 1990-2023 Emissions have changed by -15.3% (-211.71 Gg CO2 / year). For 2023
the changes per gas
are:
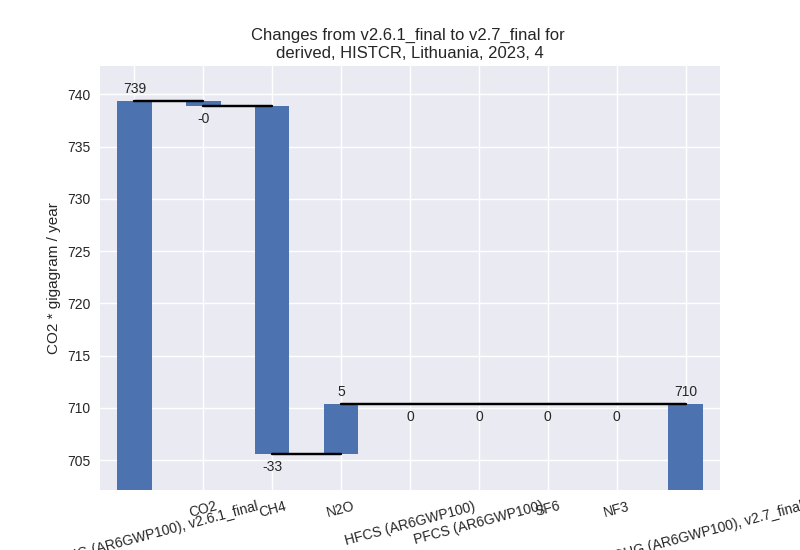
For 1990-2023 the changes per gas are: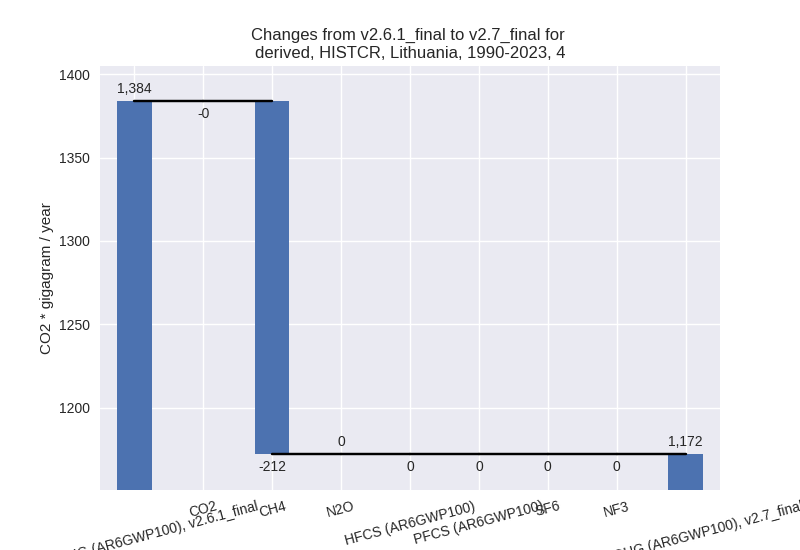
- 5: No data
third party scenario (HISTTP):
Most important changes per time frame
For 2023 the following sector-gas combinations have the highest absolute impact on national total KyotoGHG (AR6GWP100) emissions in 2023 (top 5):
- 1: 1.A, CO2 with 166.69 Gg CO2 / year (1.3%)
- 2: 2, CO2 with 0.02 Gg CO2 / year (0.0%)
- 3: 1.A, CH4 with 0.00 Gg CO2 / year (0.0%)
- 4: 2, HFCS (AR6GWP100) with 0.00 Gg CO2 / year (0.0%)
- 5: 2, NF3 with 0.00 Gg CO2 / year (0.0%)
For 1990-2023 the following sector-gas combinations have the highest absolute impact on national total KyotoGHG (AR6GWP100) emissions in 1990-2023 (top 5):
- 1: 1.A, CO2 with 9.66 Gg CO2 / year (0.1%)
- 2: 2, CO2 with 0.00 Gg CO2 / year (0.0%)
- 3: 1.A, CH4 with 0.00 Gg CO2 / year (0.0%)
- 4: 2, HFCS (AR6GWP100) with 0.00 Gg CO2 / year (0.0%)
- 5: 2, NF3 with 0.00 Gg CO2 / year (0.0%)
Changes in the main sectors for aggregate KyotoGHG (AR6GWP100) are
- 1: Total sectoral emissions in 2022 are 13398.94 Gg CO2 / year which is 56.6% of M.0.EL emissions. 2023 Emissions have changed by 1.3% (166.69 Gg CO2 / year). 1990-2023 Emissions have changed by 0.1% (9.66 Gg CO2 / year).
- 2: Total sectoral emissions in 2022 are 3922.76 Gg CO2 / year which is 16.6% of M.0.EL emissions. 2023 Emissions have changed by 0.0% (0.02 Gg CO2 / year). 1990-2023 Emissions have changed by 0.0% (0.00 Gg CO2 / year).
- M.AG: Total sectoral emissions in 2022 are 5646.01 Gg CO2 / year which is 23.9% of M.0.EL emissions. 2023 Emissions have changed by 0.0% (0.00 Gg CO2 / year). 1990-2023 Emissions have changed by 0.0% (0.00 Gg CO2 / year).
- 4: Total sectoral emissions in 2022 are 641.64 Gg CO2 / year which is 2.7% of M.0.EL emissions. 2023 Emissions have changed by 0.0% (0.00 Gg CO2 / year). 1990-2023 Emissions have changed by 0.0% (0.00 Gg CO2 / year).
- 5: Total sectoral emissions in 2022 are 56.20 Gg CO2 / year which is 0.2% of M.0.EL emissions. 2023 Emissions have changed by 0.0% (0.00 Gg CO2 / year). 1990-2023 Emissions have changed by 0.0% (0.00 Gg CO2 / year).