Changes in PRIMAP-hist v2.7_final compared to v2.6.1_final for Mexico
2025-09-11
Johannes Gütschow
Change analysis for Mexico for PRIMAP-hist v2.7_final compared to v2.6.1_final
Overview over emissions by sector and gas
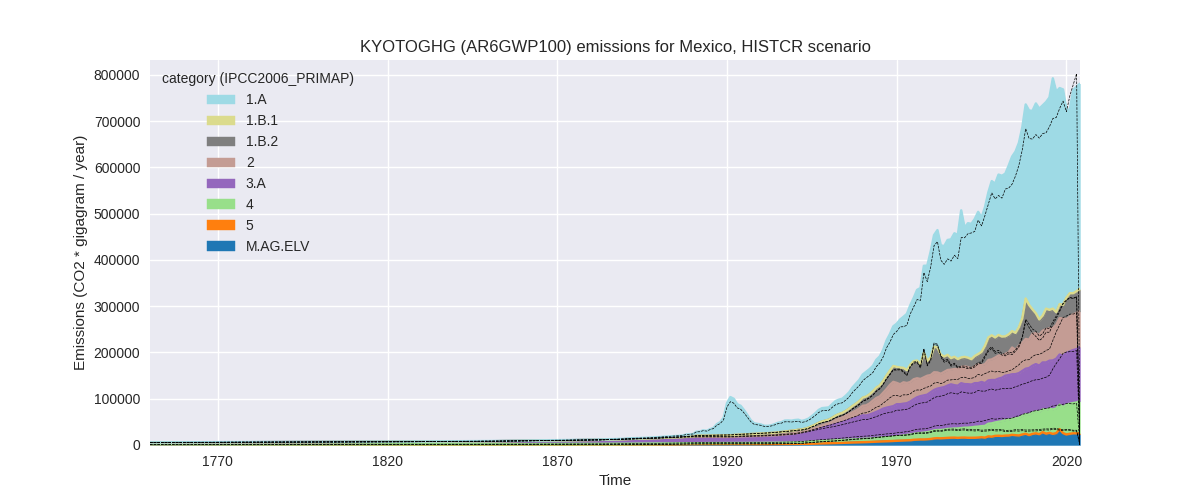
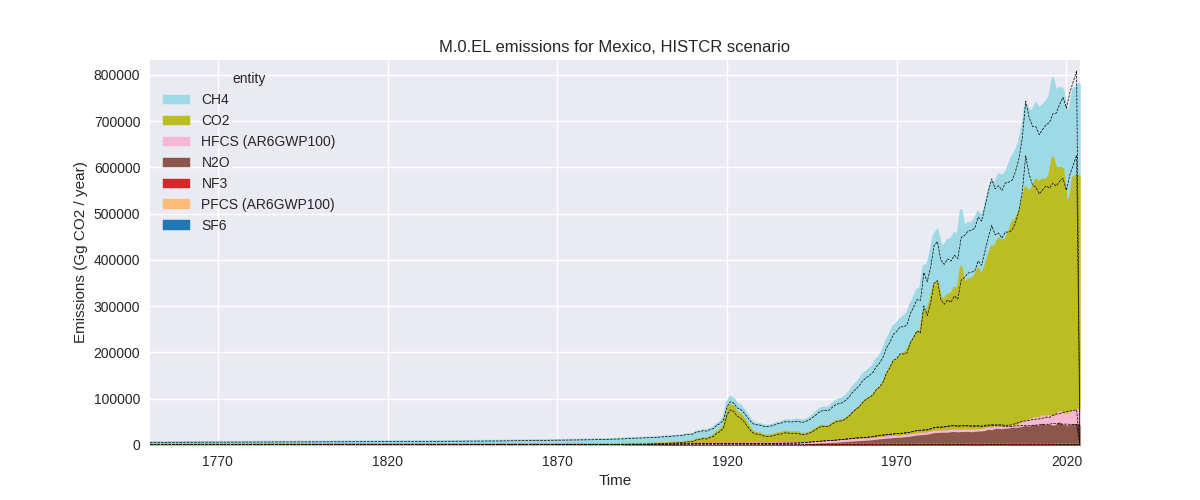
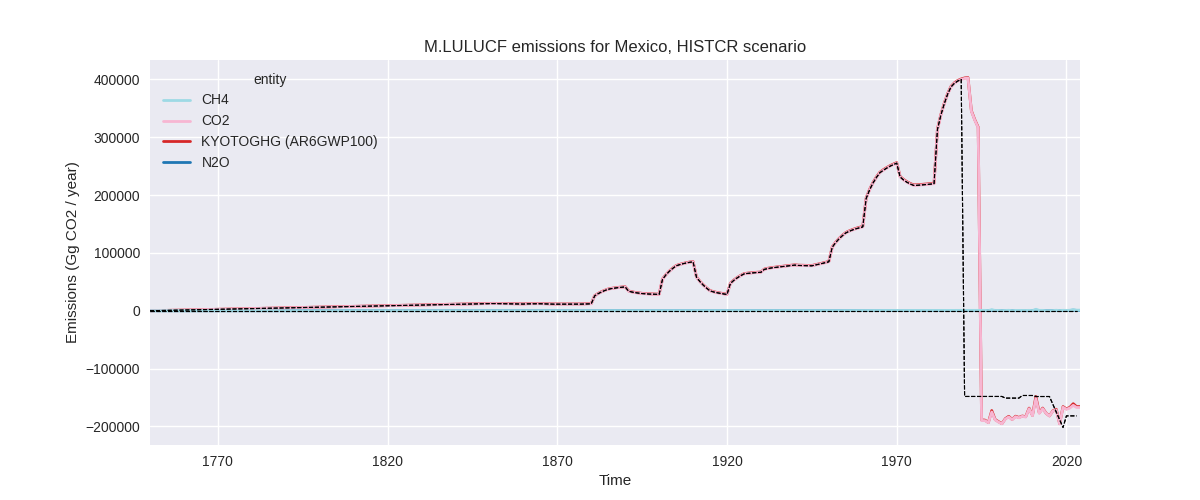
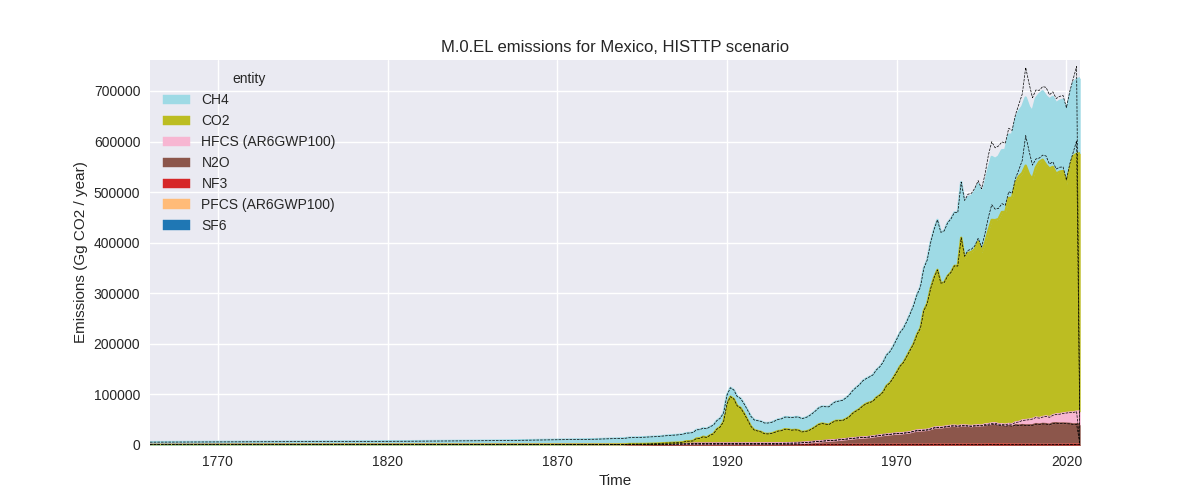
The following figures show the aggregate national total emissions excluding LULUCF AR6GWP100 for the country reported priority scenario. The dotted linesshow the v2.6.1_final data.
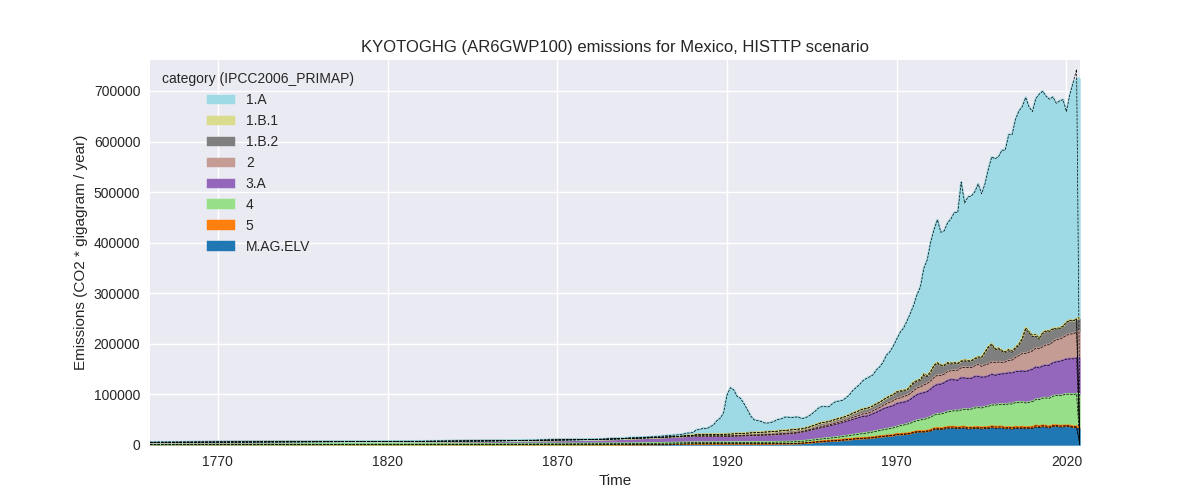
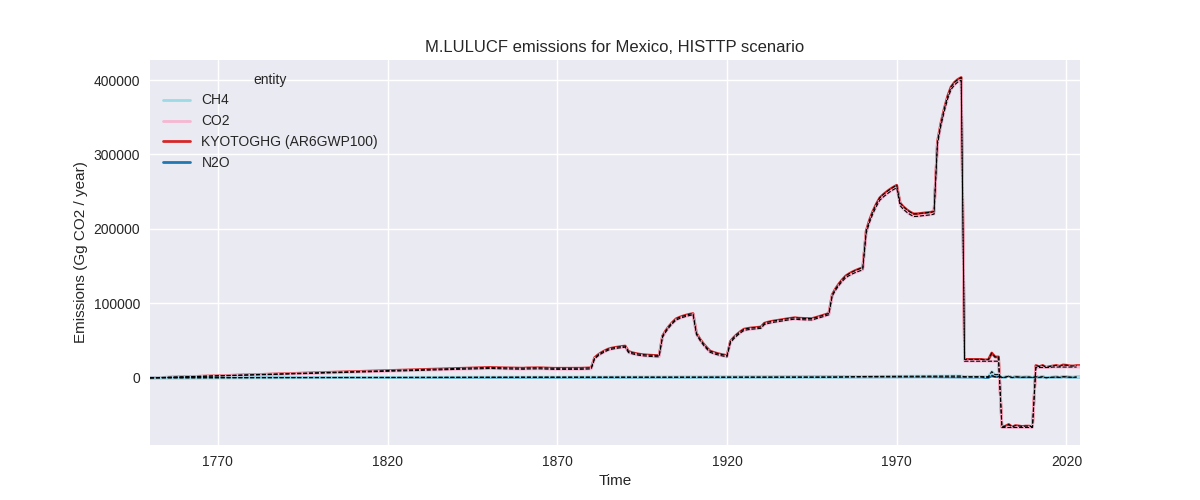
The following figures show the aggregate national total emissions excluding LULUCF AR6GWP100 for the third party priority scenario. The dotted linesshow the v2.6.1_final data.
Overview over changes
In the country reported priority scenario we have the following changes for aggregate Kyoto GHG and national total emissions excluding LULUCF (M.0.EL):
- Emissions in 2023 have changed by -4.2%% (-34084.92 Gg CO2 / year)
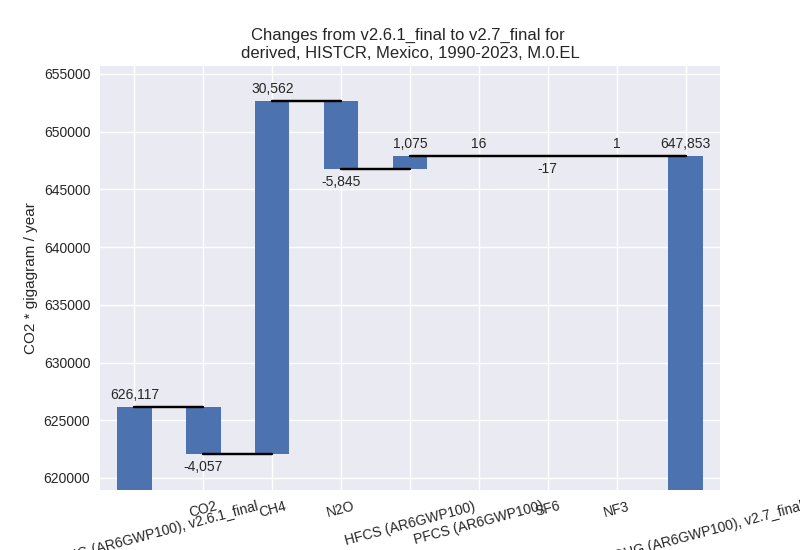
- Emissions in 1990-2023 have changed by 3.5%% (21735.52 Gg CO2 / year)
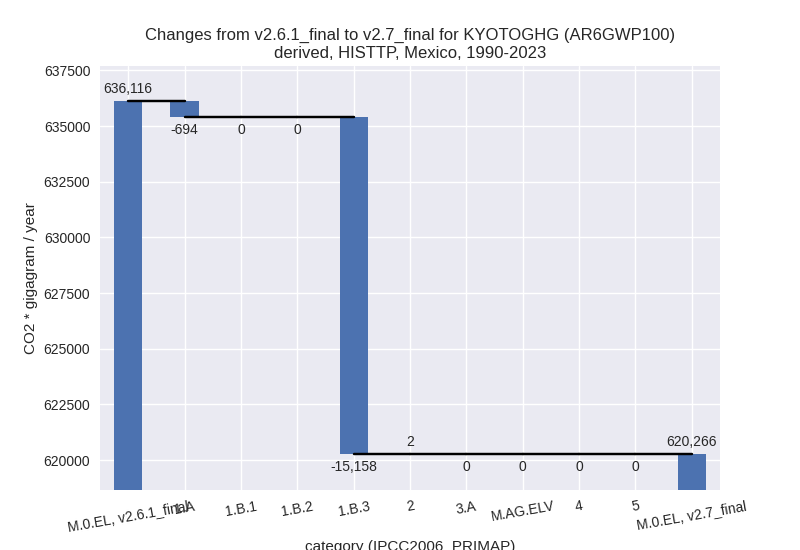
In the third party priority scenario we have the following changes for aggregate Kyoto GHG and national total emissions excluding LULUCF (M.0.EL):
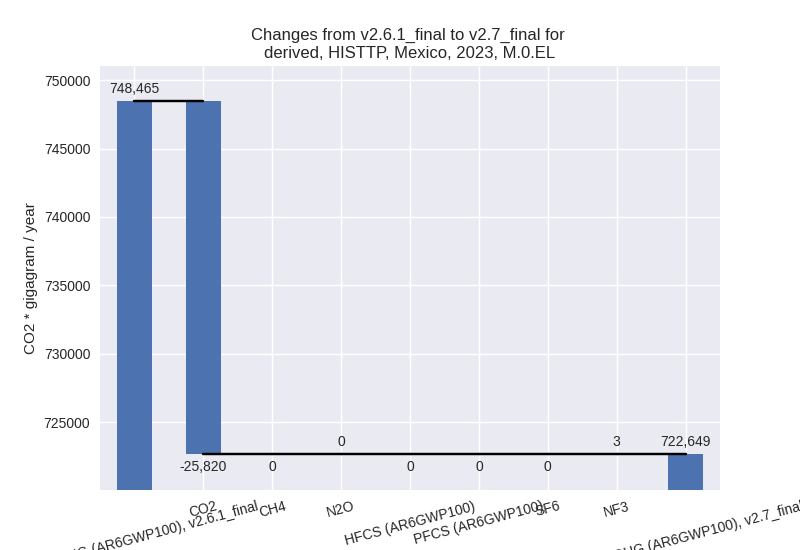
- Emissions in 2023 have changed by -3.4%% (-25815.86 Gg CO2 / year)
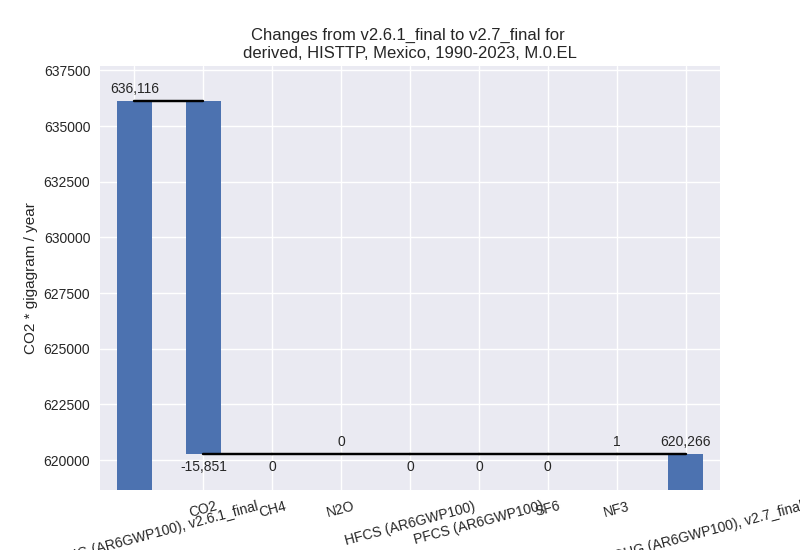
- Emissions in 1990-2023 have changed by -2.5%% (-15849.83 Gg CO2 / year)
Most important changes per scenario and time frame
In the country reported priority scenario the following sector-gas combinations have the highest absolute impact on national total KyotoGHG (AR6GWP100) emissions in 2023 (top 5):
- 1: 1.A, CO2 with -41532.27 Gg CO2 / year (-8.7%)
- 2: 1.B.2, CO2 with 6519.69 Gg CO2 / year (39.0%)
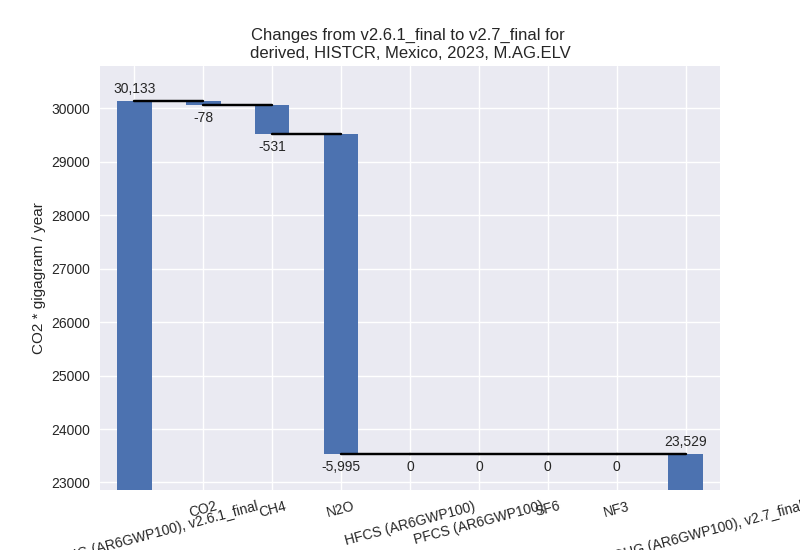
- 3: M.AG.ELV, N2O with -5994.89 Gg CO2 / year (-22.0%)
- 4: 1.B.3, CO2 with -5759.37 Gg CO2 / year (-100.0%)
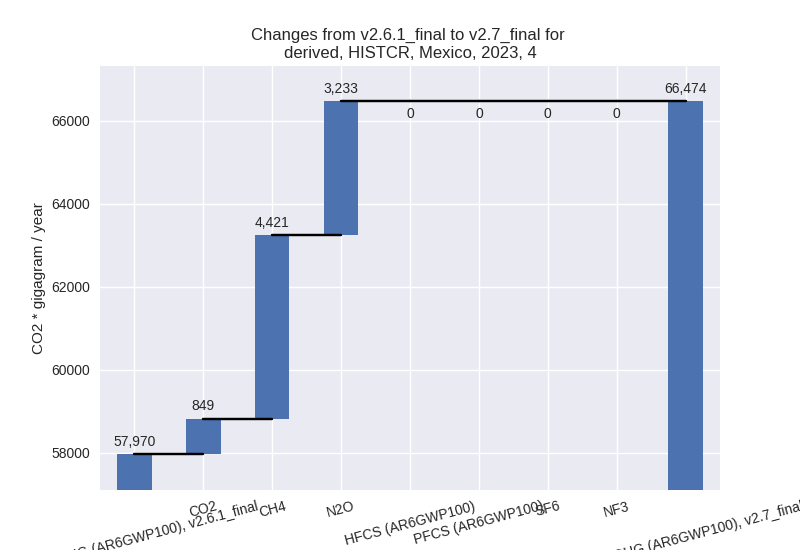
- 5: 4, CH4 with 4421.18 Gg CO2 / year (8.2%)
In the country reported priority scenario the following sector-gas combinations have the highest absolute impact on national total KyotoGHG (AR6GWP100) emissions in 1990-2023 (top 5):
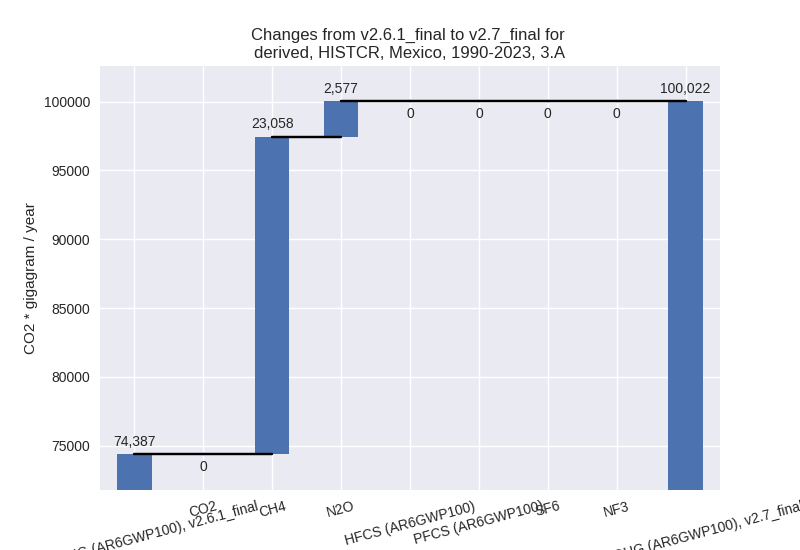
- 1: 3.A, CH4 with 23058.00 Gg CO2 / year (33.1%)
- 2: 1.B.3, CO2 with -15157.95 Gg CO2 / year (-100.0%)
- 3: M.AG.ELV, N2O with -11960.61 Gg CO2 / year (-40.8%)
- 4: 1.A, CO2 with 9208.63 Gg CO2 / year (2.5%)
- 5: 2, CO2 with 6551.00 Gg CO2 / year (17.0%)
In the third party priority scenario the following sector-gas combinations have the highest absolute impact on national total KyotoGHG (AR6GWP100) emissions in 2023 (top 5):
- 1: 1.A, CO2 with -20085.61 Gg CO2 / year (-4.1%)
- 2: 1.B.3, CO2 with -5759.37 Gg CO2 / year (-100.0%)
- 3: 2, CO2 with 25.43 Gg CO2 / year (0.1%)
- 4: 2, NF3 with 3.31 Gg CO2 / year (inf%)
- 5: 2, N2O with 0.38 Gg CO2 / year (0.1%)
In the third party priority scenario the following sector-gas combinations have the highest absolute impact on national total KyotoGHG (AR6GWP100) emissions in 1990-2023 (top 5):
- 1: 1.B.3, CO2 with -15157.95 Gg CO2 / year (-100.0%)
- 2: 1.A, CO2 with -693.59 Gg CO2 / year (-0.2%)
- 3: 2, NF3 with 1.20 Gg CO2 / year (inf%)
- 4: 2, CO2 with 0.38 Gg CO2 / year (0.0%)
- 5: 2, N2O with 0.14 Gg CO2 / year (0.0%)
Notes on data changes
Here we list notes explaining important emissions changes for the country.
- Data from BURs 2 and 3 has been replaced by data from CRT1
(1995-2022 except for 2018) and the 2024 inventory (2018). This leads to
changes in several sectors and gases.
- 3.A, CH4: emissions for 1990 - 2015 which were much lower than recent year emissions and have been taken from BUR2 have been replaced and are now in line with emissions for later years.
- Sector 1.B.3 is now empty as emissions are included in other sectors in the new submissions.
- CO2 in 1.B.2 is now lower due to the new CRT data. CH4 is higher.
- N2O emissions in M.AG.ELV are much lower than in PRIMAP-hist v2.6.1 because they are lower in CRT data.
- Energy CO2 emissions are higher before 2020 and lower after 2020 due to the new CRT data.
- Changes in IPPU CO2 mostly come from new emissions in the mineral industry sector 2.A
- Waste CH4 is higher post 2020 because the growth rates in CRT data are higher than the growth rates in EDGAR use before to extrapolate the BUR data.
- In the TP scenario changes are mostly small.
- Energy CO2 is a bit lower due to the new EI data
- 1.B.3 is now empty as the non-zero country reported data from BUR2 is no longer used.
Changes by sector and gas
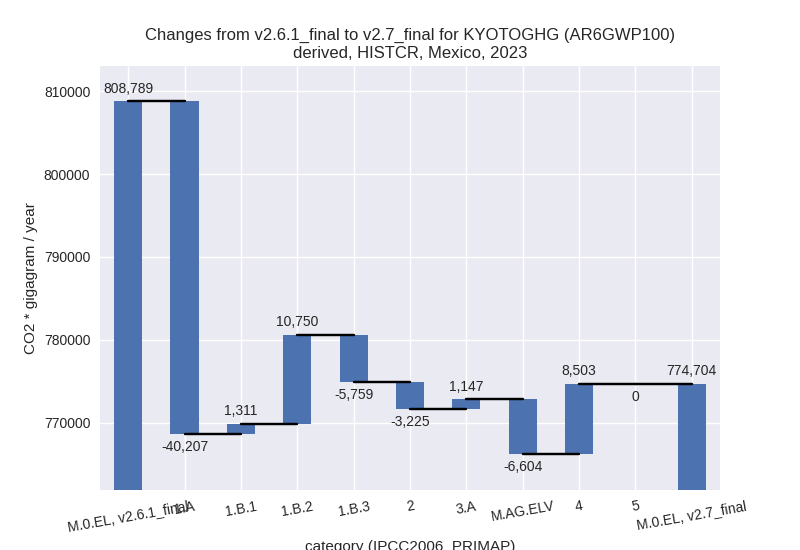
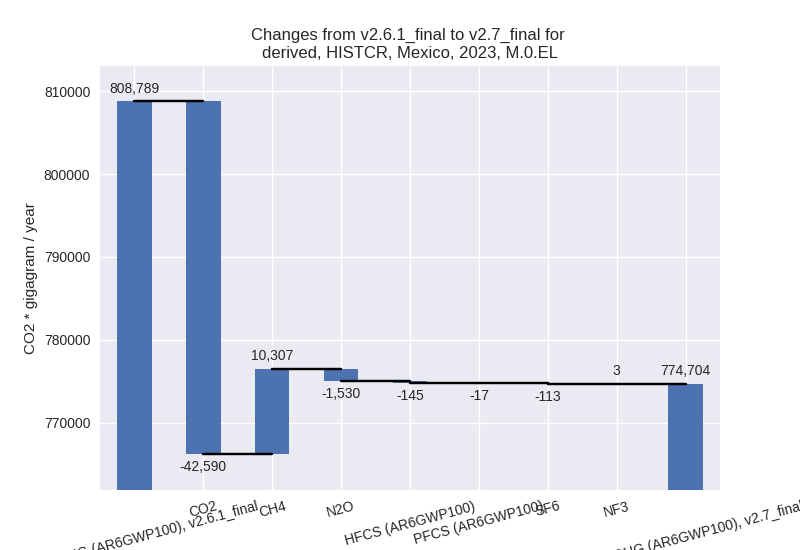
For each scenario and time frame the changes are displayed for all individual sectors and all individual gases. In the sector plot we use aggregate Kyoto GHGs in AR6GWP100. In the gas plot we usenational total emissions without LULUCF.
country reported scenario
2023
1990-2023
third party scenario
2023
1990-2023
Detailed changes for the scenarios:
country reported scenario (HISTCR):
Most important changes per time frame
For 2023 the following sector-gas combinations have the highest absolute impact on national total KyotoGHG (AR6GWP100) emissions in 2023 (top 5):
- 1: 1.A, CO2 with -41532.27 Gg CO2 / year (-8.7%)
- 2: 1.B.2, CO2 with 6519.69 Gg CO2 / year (39.0%)
- 3: M.AG.ELV, N2O with -5994.89 Gg CO2 / year (-22.0%)
- 4: 1.B.3, CO2 with -5759.37 Gg CO2 / year (-100.0%)
- 5: 4, CH4 with 4421.18 Gg CO2 / year (8.2%)
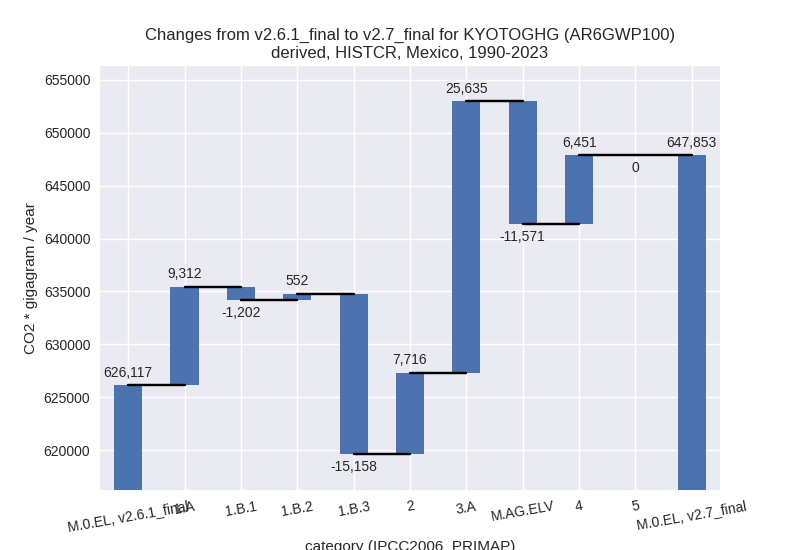
For 1990-2023 the following sector-gas combinations have the highest absolute impact on national total KyotoGHG (AR6GWP100) emissions in 1990-2023 (top 5):
- 1: 3.A, CH4 with 23058.00 Gg CO2 / year (33.1%)
- 2: 1.B.3, CO2 with -15157.95 Gg CO2 / year (-100.0%)
- 3: M.AG.ELV, N2O with -11960.61 Gg CO2 / year (-40.8%)
- 4: 1.A, CO2 with 9208.63 Gg CO2 / year (2.5%)
- 5: 2, CO2 with 6551.00 Gg CO2 / year (17.0%)
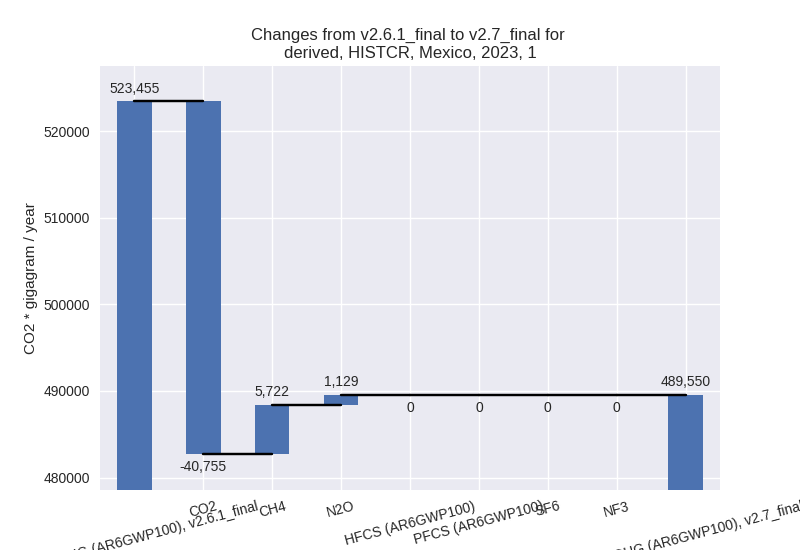
Changes in the main sectors for aggregate KyotoGHG (AR6GWP100) are
- 1: Total sectoral emissions in 2022 are 485327.87
Gg CO2 / year which is 63.2% of M.0.EL emissions. 2023 Emissions have
changed by -6.5% (-33905.11 Gg CO2 /
year). 1990-2023 Emissions have changed by -1.5% (-6496.09 Gg CO2 / year). For 2023
the changes per gas
are:
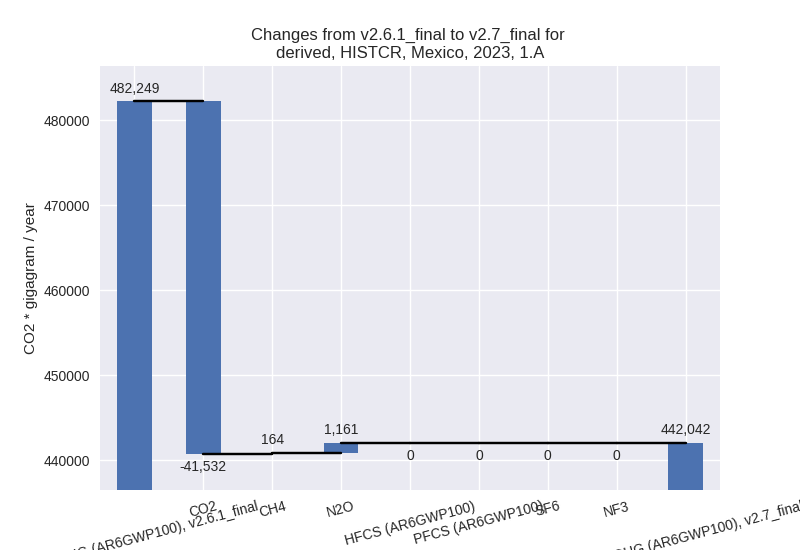
The changes come from the following subsectors:- 1.A: Total sectoral emissions in 2022 are 439829.74
Gg CO2 / year which is 90.6% of category 1 emissions. 2023 Emissions
have changed by -8.3% (-40206.68 Gg
CO2 / year). 1990-2023 Emissions have changed by 2.5% (9312.14 Gg CO2 / year). For 2023 the
changes per gas
are:
For 1990-2023 the changes per gas are: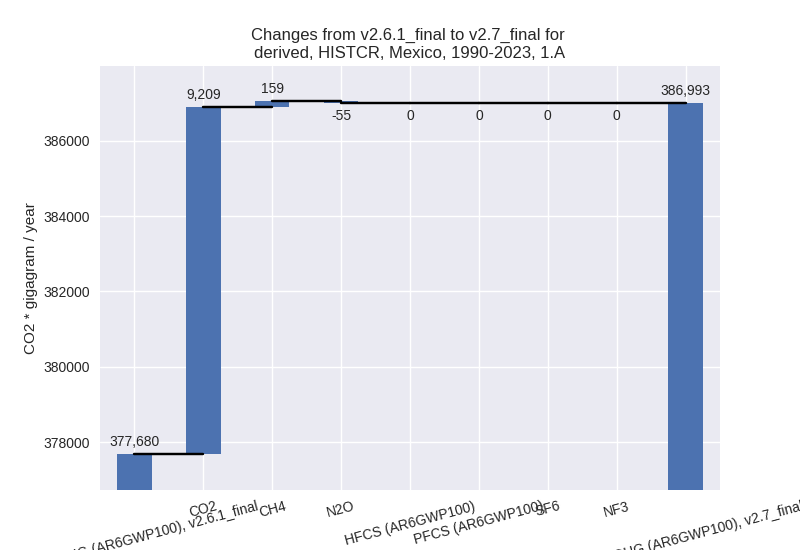
There is no subsector information available in PRIMAP-hist. - 1.B.1: Total sectoral emissions in 2022 are 1606.41
Gg CO2 / year which is 0.3% of category 1 emissions. 2023 Emissions have
changed by 470.4% (1311.19 Gg CO2 /
year). 1990-2023 Emissions have changed by -27.4% (-1201.94 Gg CO2 / year). For 2023
the changes per gas
are:
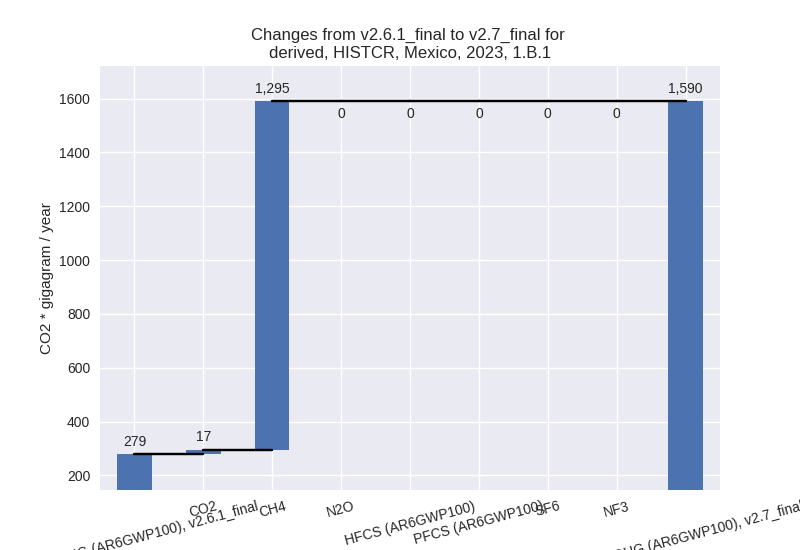
For 1990-2023 the changes per gas are: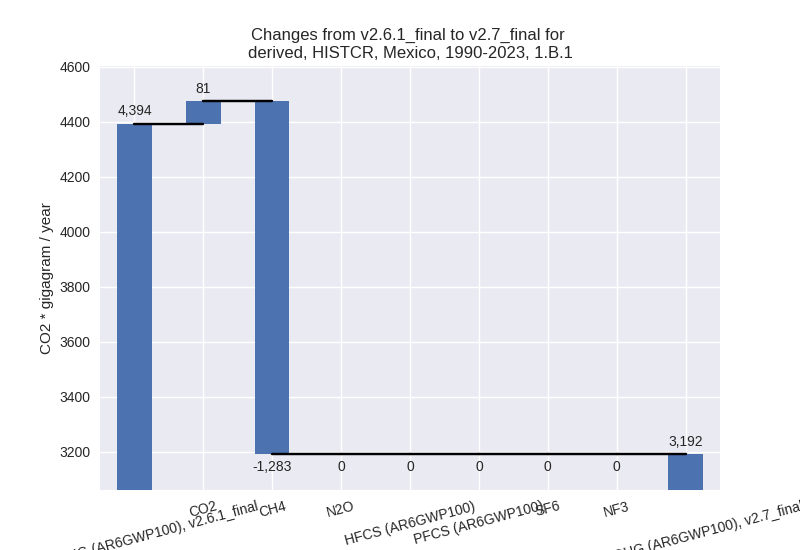
There is no subsector information available in PRIMAP-hist. - 1.B.2: Total sectoral emissions in 2022 are
43891.72 Gg CO2 / year which is 9.0% of category 1 emissions. 2023
Emissions have changed by 30.6%
(10749.75 Gg CO2 / year). 1990-2023 Emissions have changed by 1.5% (551.66 Gg CO2 / year). For 2023 the
changes per gas
are:
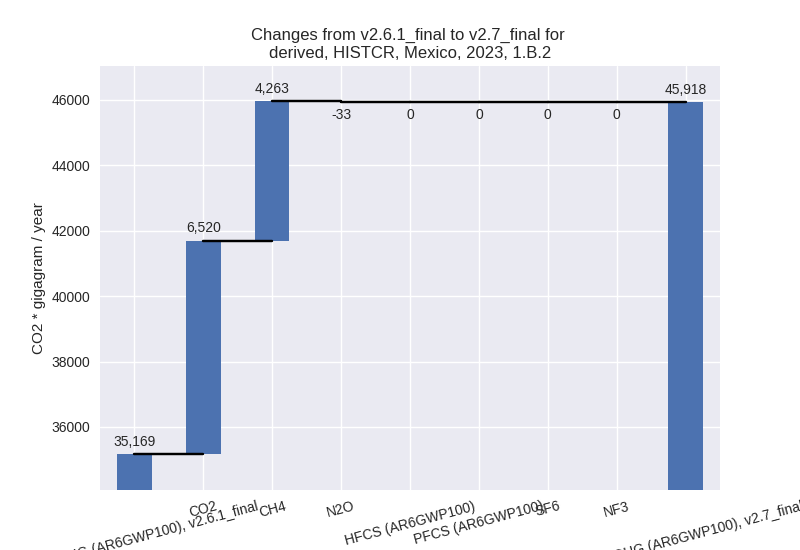
There is no subsector information available in PRIMAP-hist.
- 1.A: Total sectoral emissions in 2022 are 439829.74
Gg CO2 / year which is 90.6% of category 1 emissions. 2023 Emissions
have changed by -8.3% (-40206.68 Gg
CO2 / year). 1990-2023 Emissions have changed by 2.5% (9312.14 Gg CO2 / year). For 2023 the
changes per gas
are:
- 2: Total sectoral emissions in 2022 are 77440.22 Gg
CO2 / year which is 10.1% of M.0.EL emissions. 2023 Emissions have
changed by -4.0% (-3225.40 Gg CO2 /
year). 1990-2023 Emissions have changed by 15.3% (7716.19 Gg CO2 / year). For 2023
the changes per gas
are:
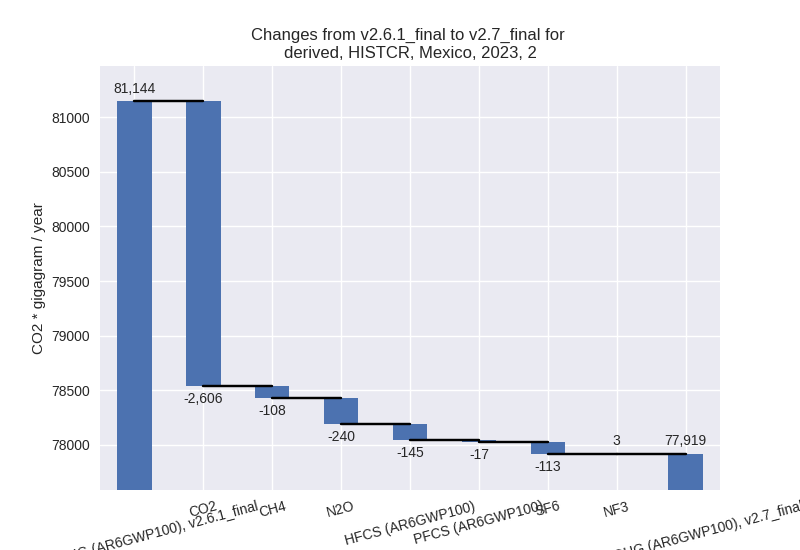
For 1990-2023 the changes per gas are: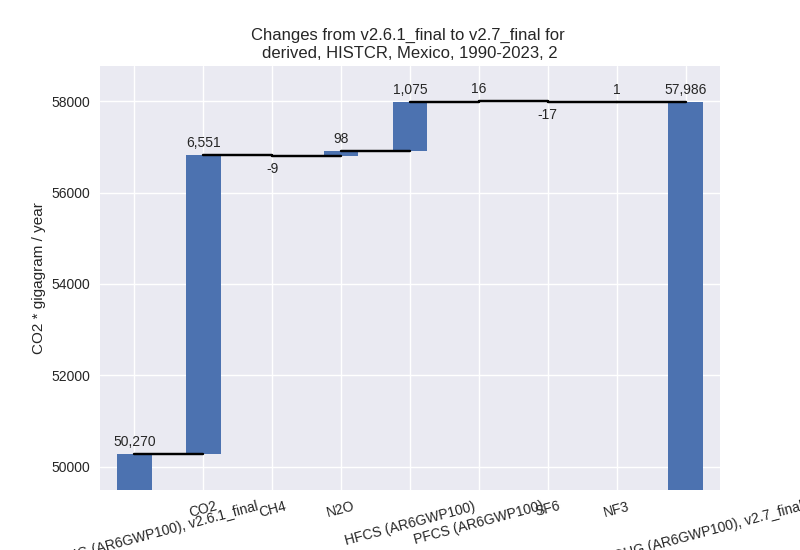
- M.AG: Total sectoral emissions in 2022 are
138126.84 Gg CO2 / year which is 18.0% of M.0.EL emissions. 2023
Emissions have changed by -3.8%
(-5457.68 Gg CO2 / year). 1990-2023 Emissions have changed by 13.4% (14063.97 Gg CO2 / year). For 2023
the changes per gas
are:
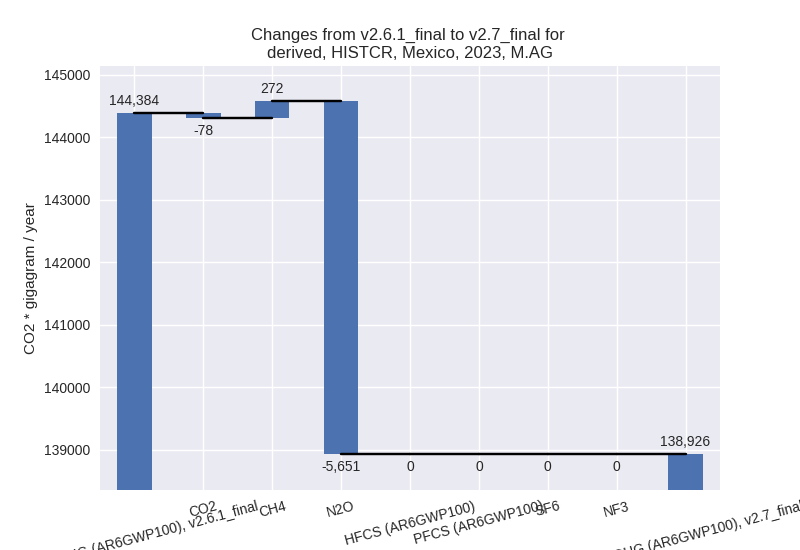
For 1990-2023 the changes per gas are: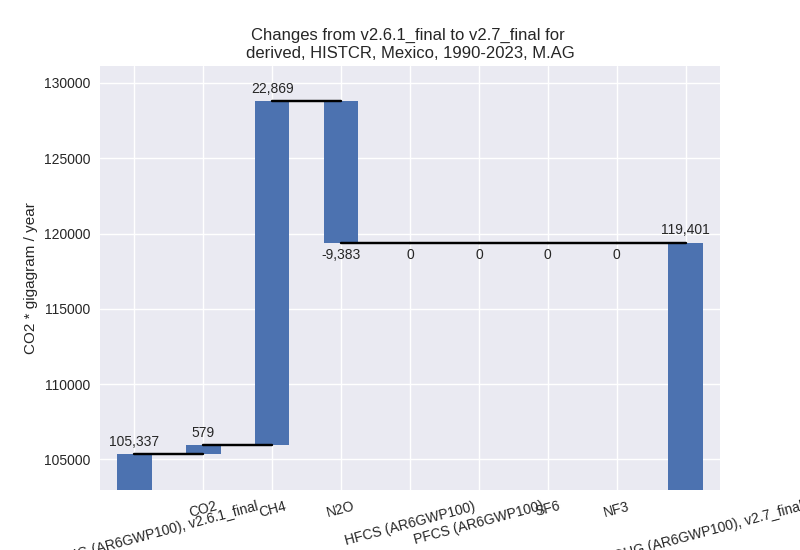
The changes come from the following subsectors:- 3.A: Total sectoral emissions in 2022 are 114598.86
Gg CO2 / year which is 83.0% of category M.AG emissions. 2023 Emissions
have changed by 1.0% (1146.61 Gg CO2
/ year). 1990-2023 Emissions have changed by 34.5% (25635.27 Gg CO2 / year). For
1990-2023 the changes per gas
are:
There is no subsector information available in PRIMAP-hist. - M.AG.ELV: Total sectoral emissions in 2022 are
23527.99 Gg CO2 / year which is 17.0% of category M.AG emissions. 2023
Emissions have changed by -21.9%
(-6604.29 Gg CO2 / year). 1990-2023 Emissions have changed by -37.4% (-11571.31 Gg CO2 / year). For 2023
the changes per gas
are:
For 1990-2023 the changes per gas are: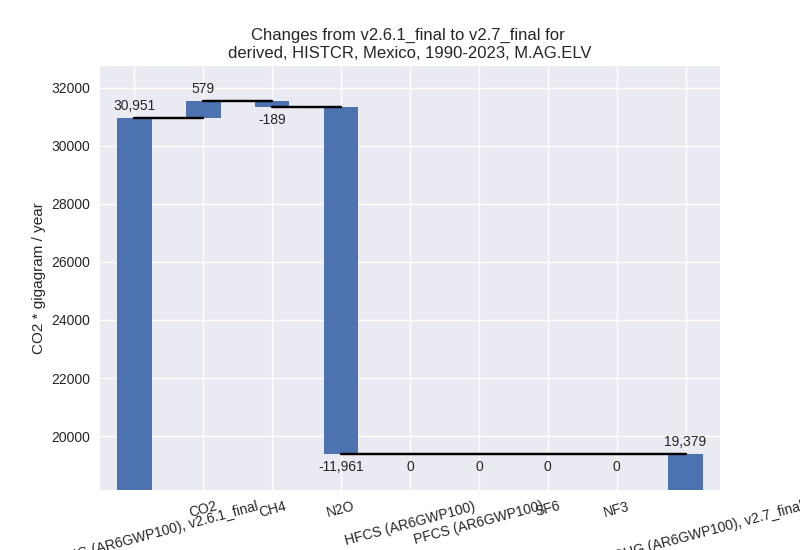
There is no subsector information available in PRIMAP-hist.
- 3.A: Total sectoral emissions in 2022 are 114598.86
Gg CO2 / year which is 83.0% of category M.AG emissions. 2023 Emissions
have changed by 1.0% (1146.61 Gg CO2
/ year). 1990-2023 Emissions have changed by 34.5% (25635.27 Gg CO2 / year). For
1990-2023 the changes per gas
are:
- 4: Total sectoral emissions in 2022 are 65377.47 Gg
CO2 / year which is 8.5% of M.0.EL emissions. 2023 Emissions have
changed by 14.7% (8503.26 Gg CO2 /
year). 1990-2023 Emissions have changed by 18.9% (6451.46 Gg CO2 / year). For 2023
the changes per gas
are:
For 1990-2023 the changes per gas are: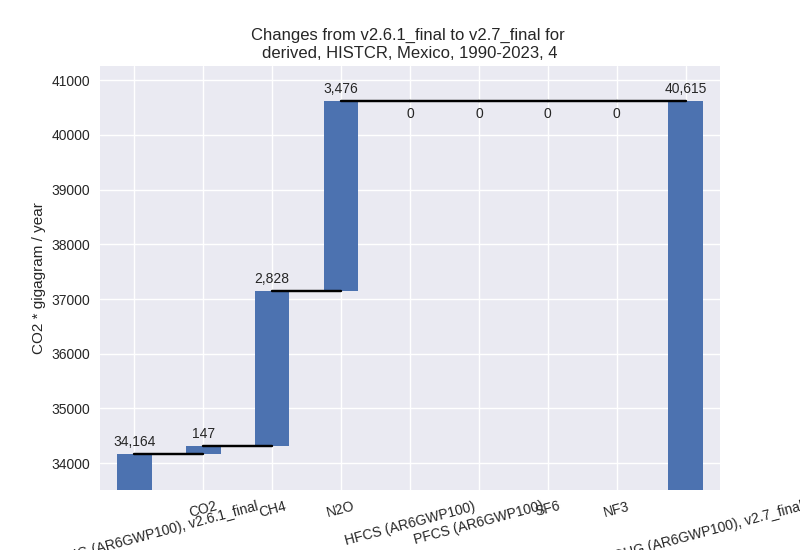
- 5: Total sectoral emissions in 2022 are 1760.22 Gg CO2 / year which is 0.2% of M.0.EL emissions. 2023 Emissions have changed by 0.0% (0.00 Gg CO2 / year). 1990-2023 Emissions have changed by 0.0% (0.00 Gg CO2 / year).
third party scenario (HISTTP):
Most important changes per time frame
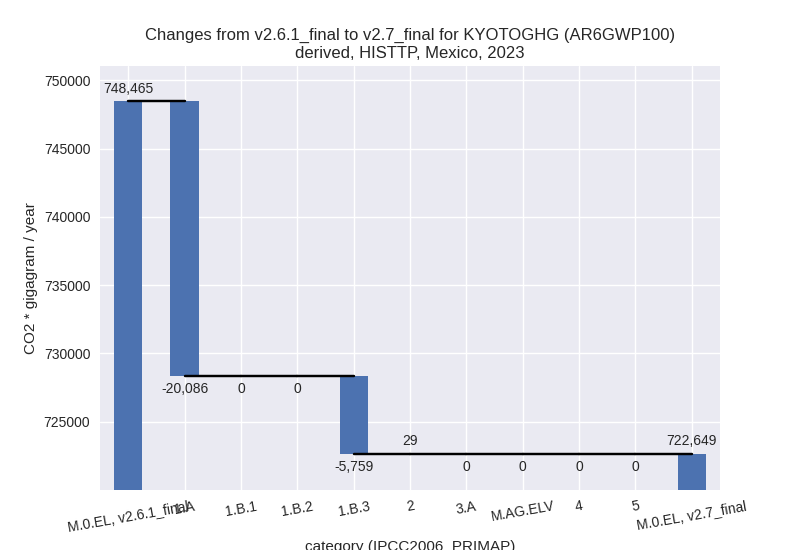
For 2023 the following sector-gas combinations have the highest absolute impact on national total KyotoGHG (AR6GWP100) emissions in 2023 (top 5):
- 1: 1.A, CO2 with -20085.61 Gg CO2 / year (-4.1%)
- 2: 1.B.3, CO2 with -5759.37 Gg CO2 / year (-100.0%)
- 3: 2, CO2 with 25.43 Gg CO2 / year (0.1%)
- 4: 2, NF3 with 3.31 Gg CO2 / year (inf%)
- 5: 2, N2O with 0.38 Gg CO2 / year (0.1%)
For 1990-2023 the following sector-gas combinations have the highest absolute impact on national total KyotoGHG (AR6GWP100) emissions in 1990-2023 (top 5):
- 1: 1.B.3, CO2 with -15157.95 Gg CO2 / year (-100.0%)
- 2: 1.A, CO2 with -693.59 Gg CO2 / year (-0.2%)
- 3: 2, NF3 with 1.20 Gg CO2 / year (inf%)
- 4: 2, CO2 with 0.38 Gg CO2 / year (0.0%)
- 5: 2, N2O with 0.14 Gg CO2 / year (0.0%)
Changes in the main sectors for aggregate KyotoGHG (AR6GWP100) are
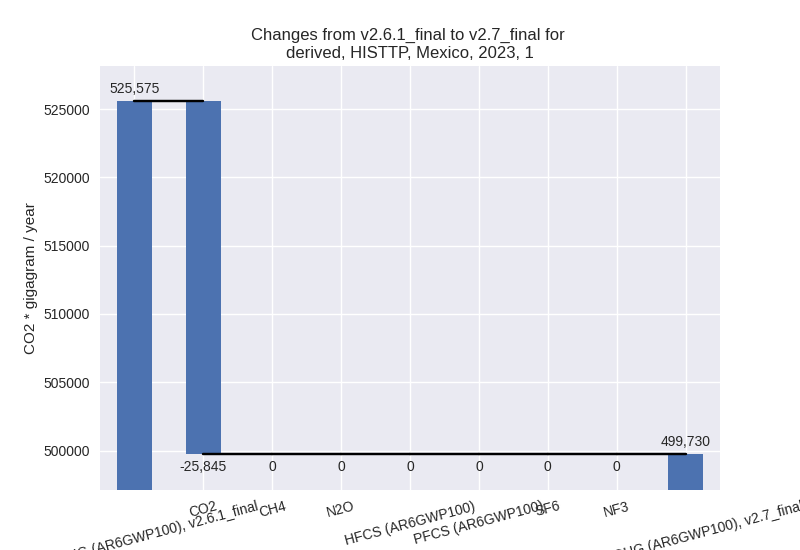
- 1: Total sectoral emissions in 2022 are 496162.18
Gg CO2 / year which is 69.3% of M.0.EL emissions. 2023 Emissions have
changed by -4.9% (-25844.97 Gg CO2 /
year). 1990-2023 Emissions have changed by -3.5% (-15851.54 Gg CO2 / year). For 2023
the changes per gas
are:
For 1990-2023 the changes per gas are: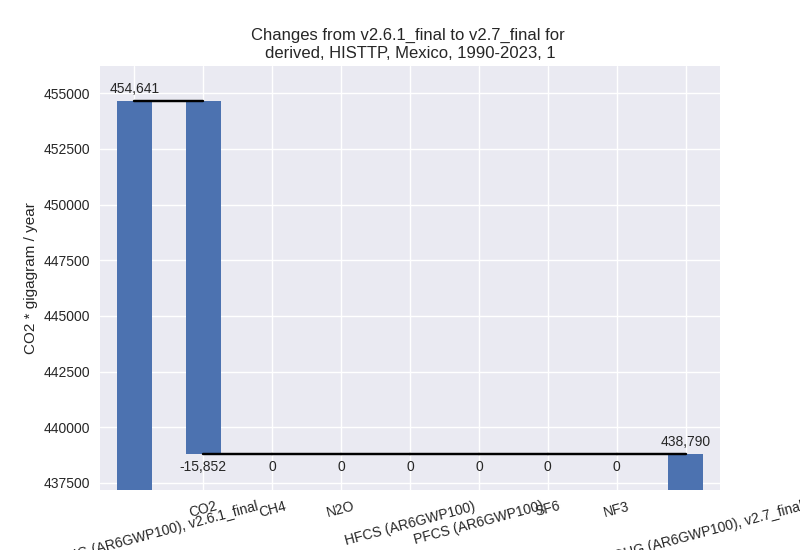
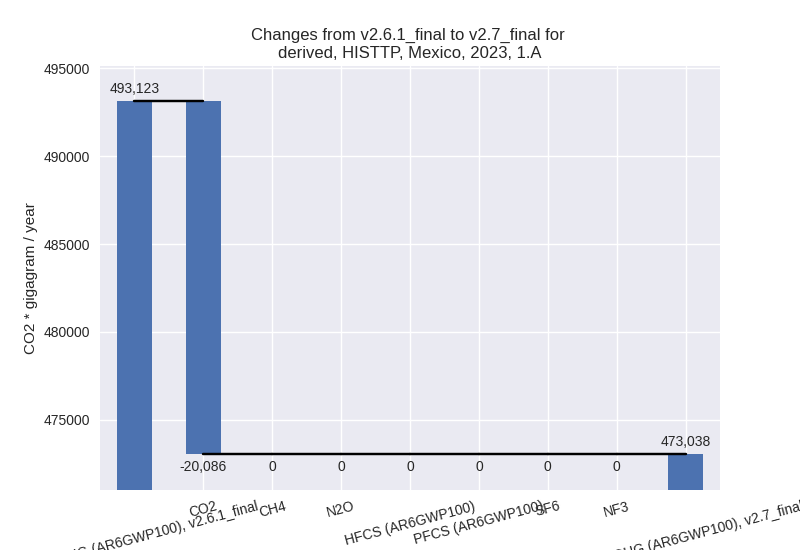
The changes come from the following subsectors:- 1.A: Total sectoral emissions in 2022 are 470680.00
Gg CO2 / year which is 94.9% of category 1 emissions. 2023 Emissions
have changed by -4.1% (-20085.61 Gg
CO2 / year). 1990-2023 Emissions have changed by -0.2% (-693.59 Gg CO2 / year). For 2023
the changes per gas
are:
There is no subsector information available in PRIMAP-hist. - 1.B.1: Total sectoral emissions in 2022 are 378.97 Gg CO2 / year which is 0.1% of category 1 emissions. 2023 Emissions have changed by 0.0% (0.00 Gg CO2 / year). 1990-2023 Emissions have changed by 0.0% (0.00 Gg CO2 / year).
- 1.B.2: Total sectoral emissions in 2022 are 25103.20 Gg CO2 / year which is 5.1% of category 1 emissions. 2023 Emissions have changed by 0.0% (0.00 Gg CO2 / year). 1990-2023 Emissions have changed by 0.0% (0.00 Gg CO2 / year).
- 1.A: Total sectoral emissions in 2022 are 470680.00
Gg CO2 / year which is 94.9% of category 1 emissions. 2023 Emissions
have changed by -4.1% (-20085.61 Gg
CO2 / year). 1990-2023 Emissions have changed by -0.2% (-693.59 Gg CO2 / year). For 2023
the changes per gas
are:
- 2: Total sectoral emissions in 2022 are 49672.11 Gg CO2 / year which is 6.9% of M.0.EL emissions. 2023 Emissions have changed by 0.1% (29.12 Gg CO2 / year). 1990-2023 Emissions have changed by 0.0% (1.71 Gg CO2 / year).
- M.AG: Total sectoral emissions in 2022 are 104798.93 Gg CO2 / year which is 14.6% of M.0.EL emissions. 2023 Emissions have changed by 0.0% (0.00 Gg CO2 / year). 1990-2023 Emissions have changed by 0.0% (0.00 Gg CO2 / year).
- 4: Total sectoral emissions in 2022 are 63676.68 Gg CO2 / year which is 8.9% of M.0.EL emissions. 2023 Emissions have changed by 0.0% (0.00 Gg CO2 / year). 1990-2023 Emissions have changed by 0.0% (0.00 Gg CO2 / year).
- 5: Total sectoral emissions in 2022 are 1760.22 Gg CO2 / year which is 0.2% of M.0.EL emissions. 2023 Emissions have changed by 0.0% (0.00 Gg CO2 / year). 1990-2023 Emissions have changed by 0.0% (0.00 Gg CO2 / year).