Changes in PRIMAP-hist v2.7_final compared to v2.6.1_final for Pakistan
2025-09-11
Johannes Gütschow
Change analysis for Pakistan for PRIMAP-hist v2.7_final compared to v2.6.1_final
Overview over emissions by sector and gas
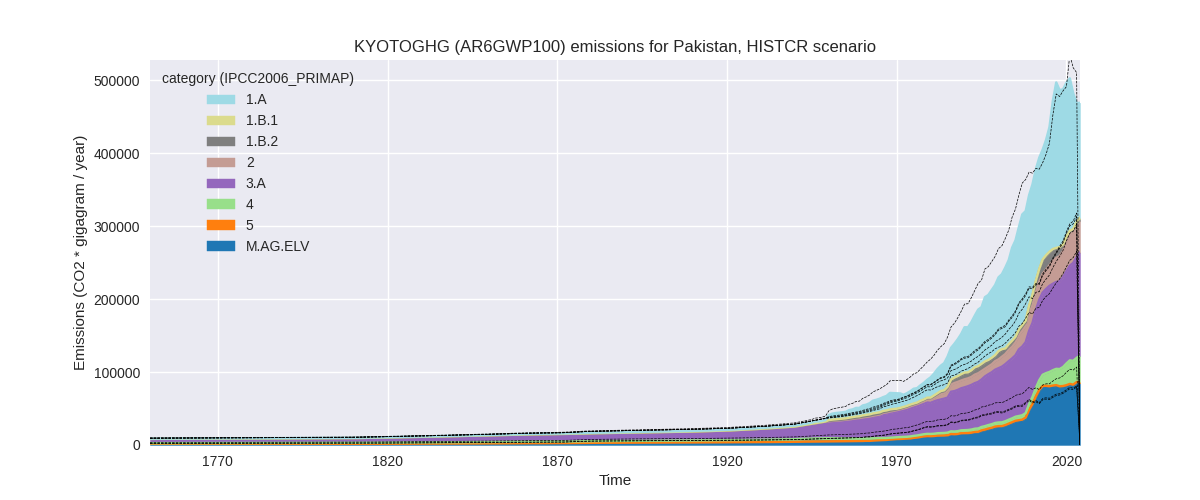
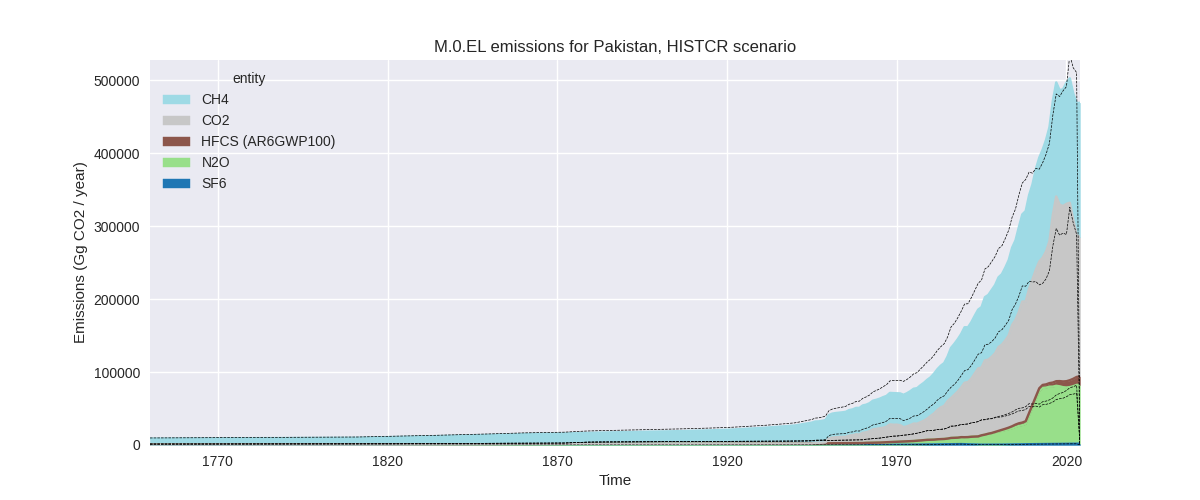
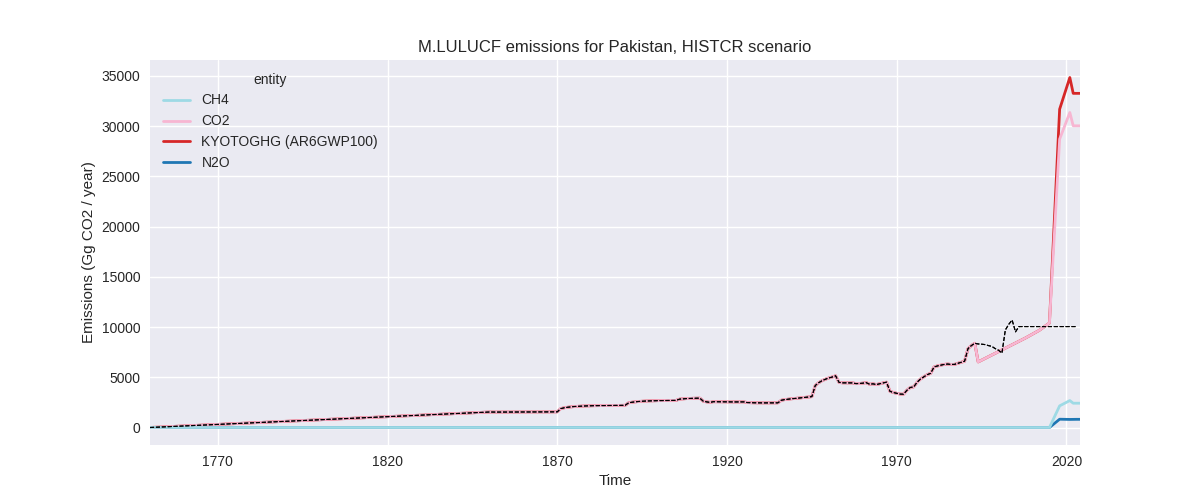
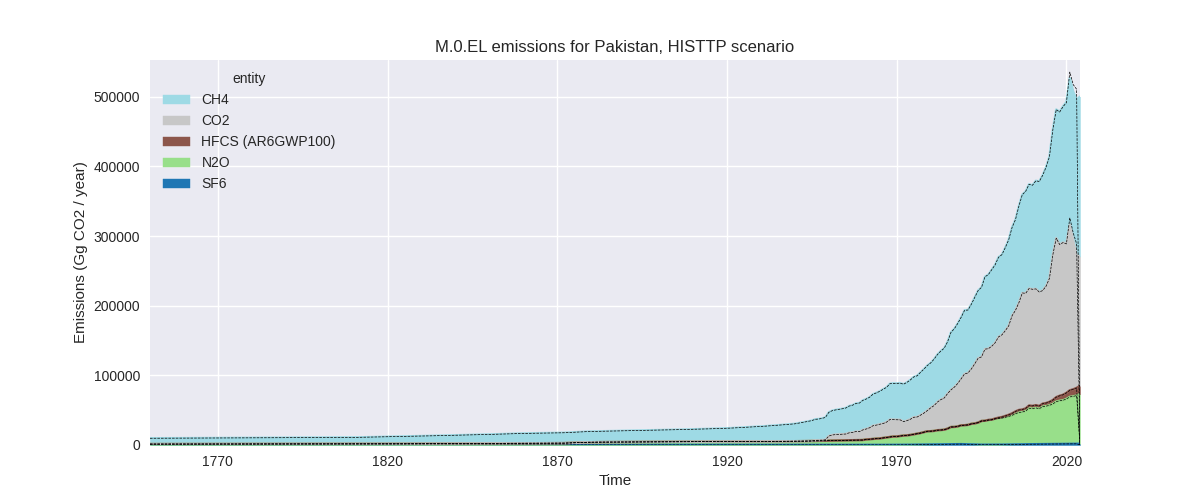
The following figures show the aggregate national total emissions excluding LULUCF AR6GWP100 for the country reported priority scenario. The dotted linesshow the v2.6.1_final data.
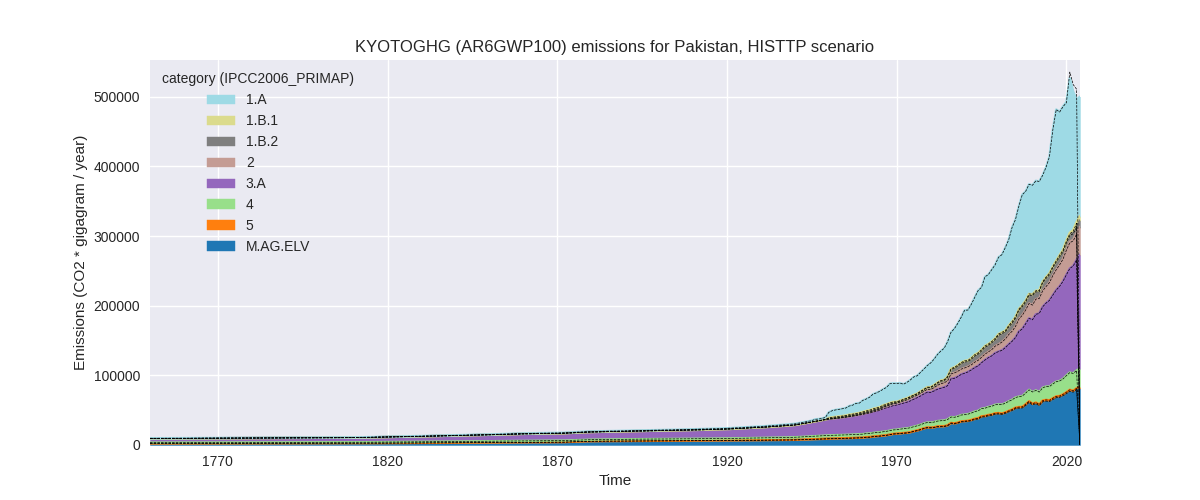
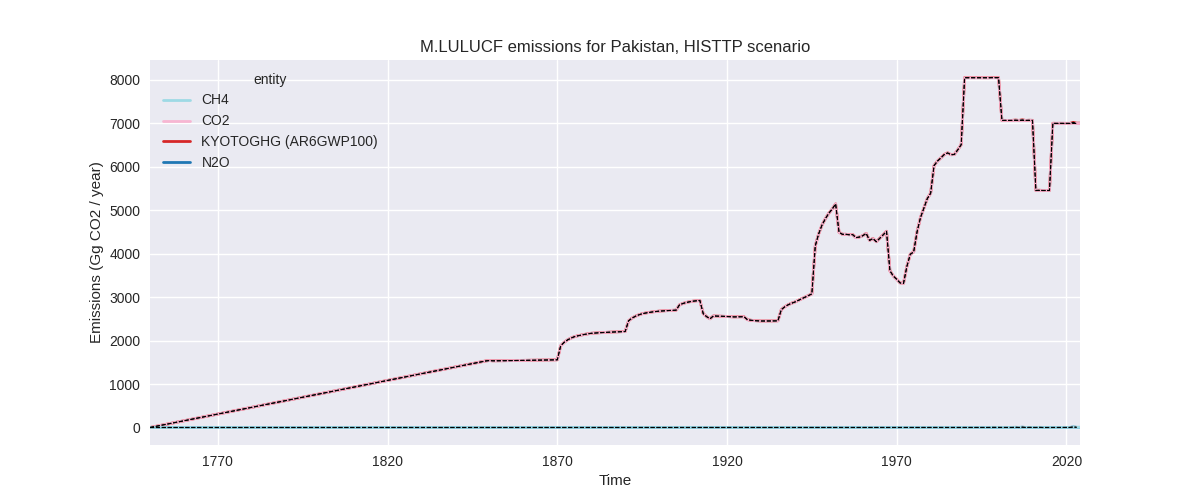
The following figures show the aggregate national total emissions excluding LULUCF AR6GWP100 for the third party priority scenario. The dotted linesshow the v2.6.1_final data.
Overview over changes
In the country reported priority scenario we have the following changes for aggregate Kyoto GHG and national total emissions excluding LULUCF (M.0.EL):
- Emissions in 2023 have changed by -8.2%% (-41898.20 Gg CO2 / year)
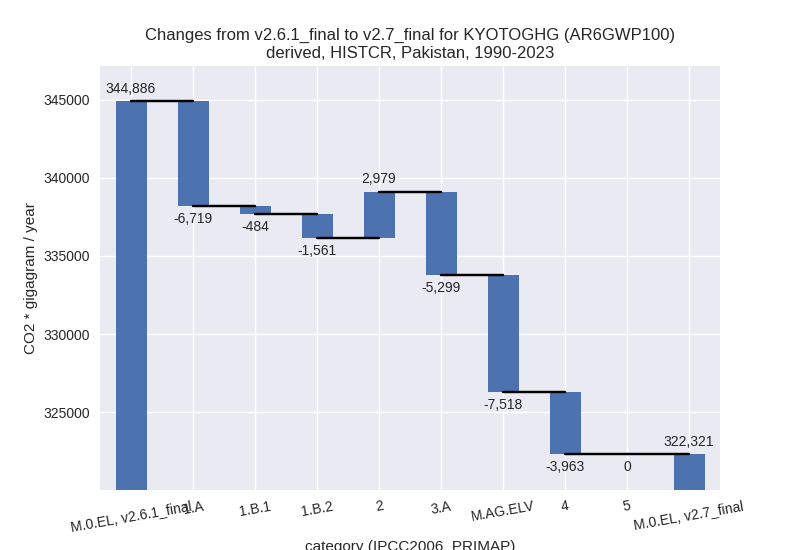
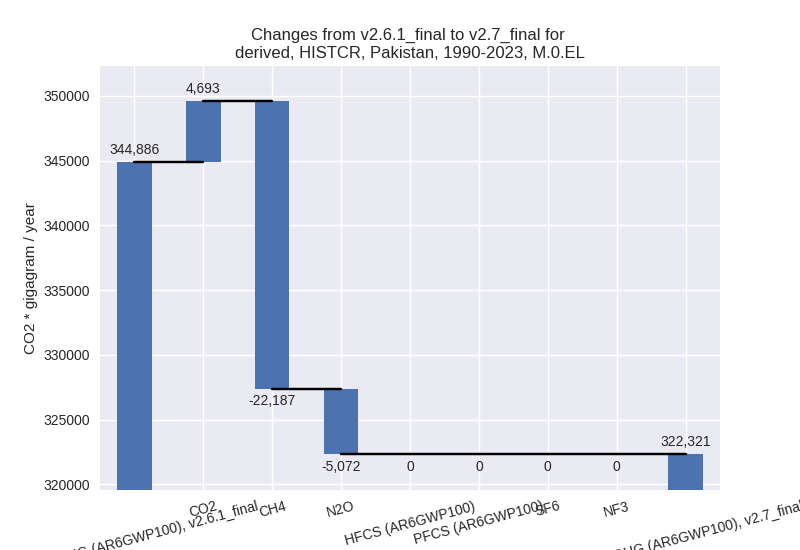
- Emissions in 1990-2023 have changed by -6.5%% (-22565.76 Gg CO2 / year)
In the third party priority scenario we have the following changes for aggregate Kyoto GHG and national total emissions excluding LULUCF (M.0.EL):
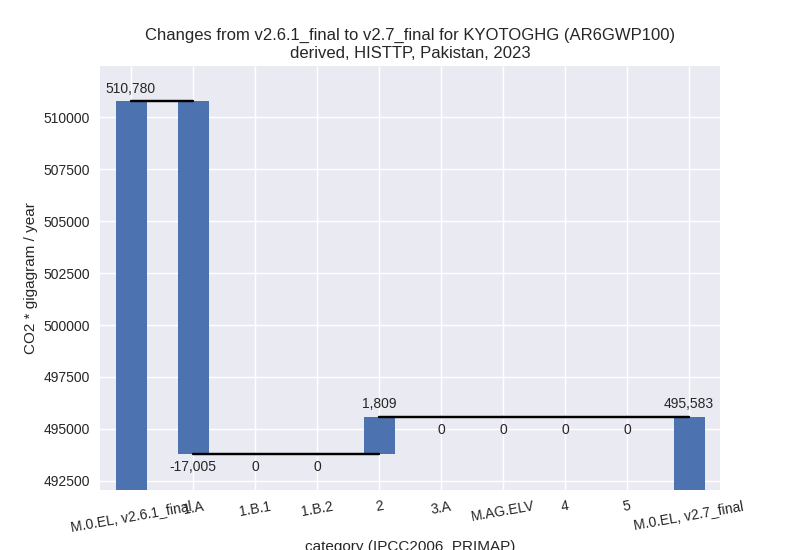
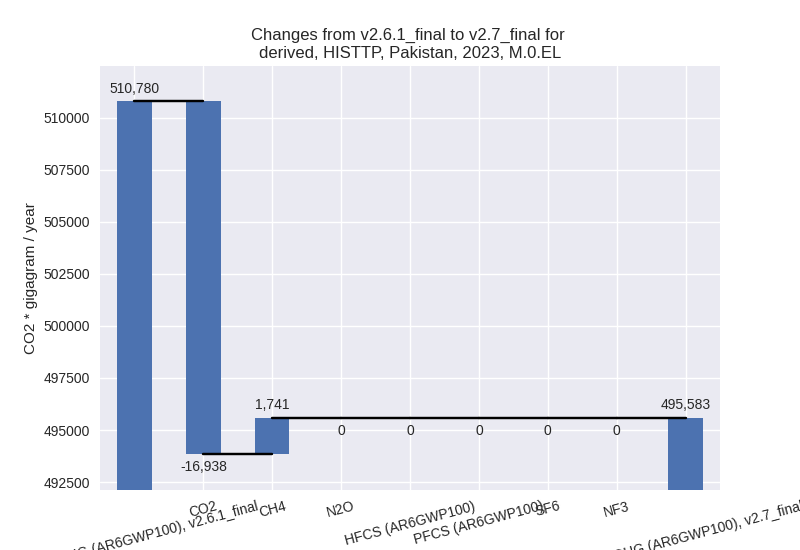
- Emissions in 2023 have changed by -3.0%% (-15196.74 Gg CO2 / year)
- Emissions in 1990-2023 have changed by -0.3%% (-958.80 Gg CO2 / year)
Most important changes per scenario and time frame
In the country reported priority scenario the following sector-gas combinations have the highest absolute impact on national total KyotoGHG (AR6GWP100) emissions in 2023 (top 5):
- 1: 3.A, CH4 with -27051.78 Gg CO2 / year (-17.3%)
- 2: 1.A, CO2 with -15864.36 Gg CO2 / year (-9.0%)
- 3: 1.A, CH4 with -11484.26 Gg CO2 / year (-92.2%)
- 4: 4, CH4 with 7866.46 Gg CO2 / year (34.4%)
- 5: M.AG.ELV, N2O with 7283.86 Gg CO2 / year (12.3%)
In the country reported priority scenario the following sector-gas combinations have the highest absolute impact on national total KyotoGHG (AR6GWP100) emissions in 1990-2023 (top 5):
- 1: 3.A, CH4 with -6617.32 Gg CO2 / year (-6.8%)
- 2: 1.A, CH4 with -6446.16 Gg CO2 / year (-68.6%)
- 3: M.AG.ELV, N2O with -4131.56 Gg CO2 / year (-10.5%)
- 4: 4, CH4 with -3874.65 Gg CO2 / year (-27.1%)
- 5: M.AG.ELV, CH4 with -3386.56 Gg CO2 / year (-31.9%)
In the third party priority scenario the following sector-gas combinations have the highest absolute impact on national total KyotoGHG (AR6GWP100) emissions in 2023 (top 5):
- 1: 1.A, CO2 with -17005.31 Gg CO2 / year (-9.6%)
- 2: 2, CH4 with 1741.35 Gg CO2 / year (inf%)
- 3: 2, CO2 with 67.22 Gg CO2 / year (0.3%)
- 4: 1.A, CH4 with 0.00 Gg CO2 / year (0.0%)
- 5: 1.A, N2O with 0.00 Gg CO2 / year (0.0%)
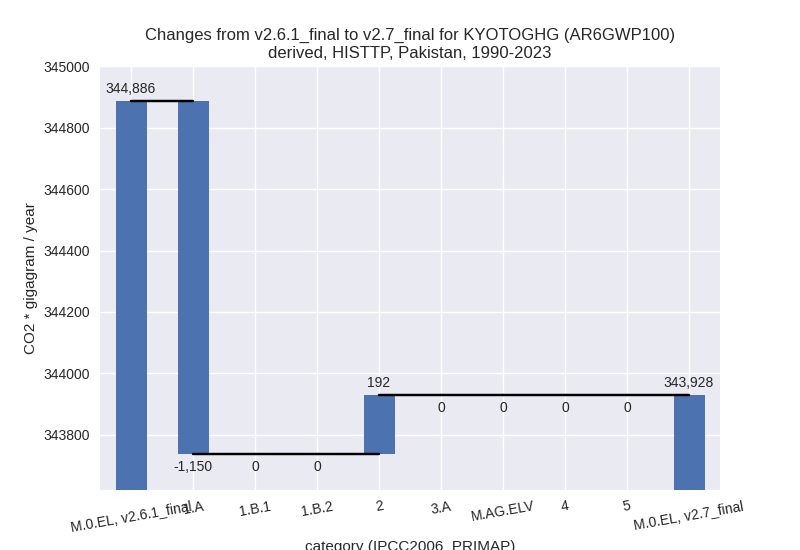
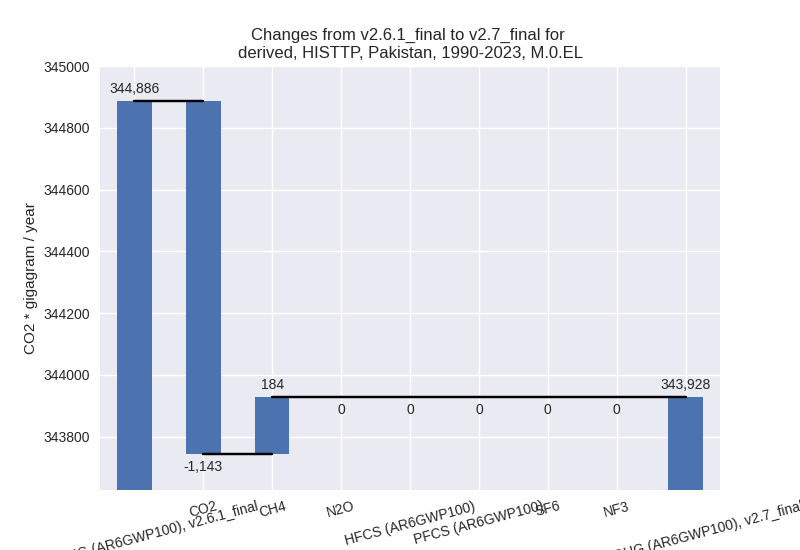
In the third party priority scenario the following sector-gas combinations have the highest absolute impact on national total KyotoGHG (AR6GWP100) emissions in 1990-2023 (top 5):
- 1: 1.A, CO2 with -1150.42 Gg CO2 / year (-0.9%)
- 2: 2, CH4 with 184.50 Gg CO2 / year (13298.7%)
- 3: 2, CO2 with 7.12 Gg CO2 / year (0.1%)
- 4: 1.A, CH4 with 0.00 Gg CO2 / year (0.0%)
- 5: 1.A, N2O with 0.00 Gg CO2 / year (0.0%)
Notes on data changes
Here we list notes explaining important emissions changes for the country.
- BTR1 data for 2021 and data for 1994, 2000, 2012 from the 2016
inventory report is combined with data from 2018 from BUR1 and 2015 from
DI and allows us to use country reported data for the first time. DI
data for 2015 is downscaled to individual gases using shares from the
2016 inventory. BUR1 data for 2018 needs gas downscaling in the IPPU
sector which is done using shares from BTR1. Overall emissions are
significantly lower for the CR time-series.
- CH4 emissions in 3.A are lower, especially since 2010 because we replace FAOSTAT data with country reported data.
- Energy CO2 is higher before 2021 but lower starting in 2021 because the 2021 value in the CR data is lower than the 2021 value from CDIAC and EI data used in PRIMAP-hist v.2.6.1. EI data has changed significantly from the 2024 to the 2025 version as well.
- CH4 and N2O in the energy sector are much lower in CR data than in EDGAR.
- Waste emissions differ a lot from EDGAR waste emissions for CH4 and N2O.
- Emissions in M.AG.ELV differ from FAOSTAT and are consistently lower for CH4 and for N2O lower pre-2010 and higher post-2010.
- Emissions from the IPPU sector have also changed for all subsectors because EDGAR has been replaced by CR data.
- For the TP time-series the most significant change is a reduction in
Energy CO2 for recent years due to the new EI data.
- A further change is that CH4 in the IPPU sector is now much higher as there is country reported data for 2.H where no EDGAR data exists.
Changes by sector and gas
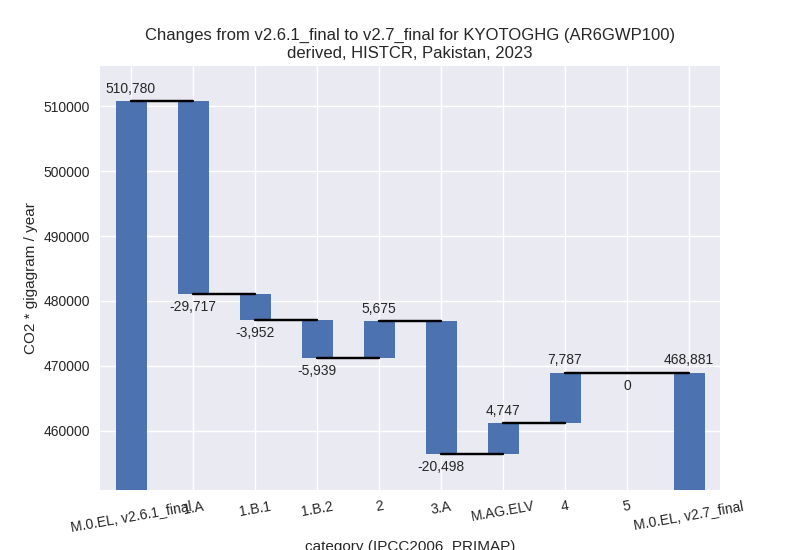
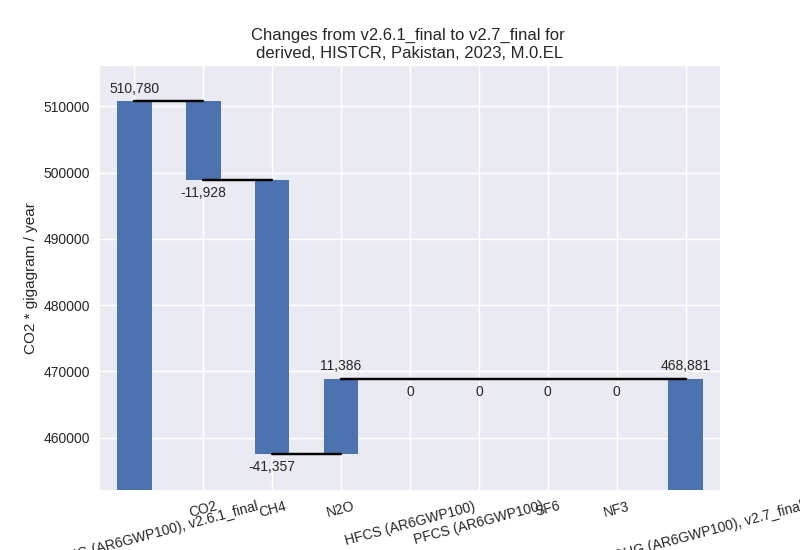
For each scenario and time frame the changes are displayed for all individual sectors and all individual gases. In the sector plot we use aggregate Kyoto GHGs in AR6GWP100. In the gas plot we usenational total emissions without LULUCF.
country reported scenario
2023
1990-2023
third party scenario
2023
1990-2023
Detailed changes for the scenarios:
country reported scenario (HISTCR):
Most important changes per time frame
For 2023 the following sector-gas combinations have the highest absolute impact on national total KyotoGHG (AR6GWP100) emissions in 2023 (top 5):
- 1: 3.A, CH4 with -27051.78 Gg CO2 / year (-17.3%)
- 2: 1.A, CO2 with -15864.36 Gg CO2 / year (-9.0%)
- 3: 1.A, CH4 with -11484.26 Gg CO2 / year (-92.2%)
- 4: 4, CH4 with 7866.46 Gg CO2 / year (34.4%)
- 5: M.AG.ELV, N2O with 7283.86 Gg CO2 / year (12.3%)
For 1990-2023 the following sector-gas combinations have the highest absolute impact on national total KyotoGHG (AR6GWP100) emissions in 1990-2023 (top 5):
- 1: 3.A, CH4 with -6617.32 Gg CO2 / year (-6.8%)
- 2: 1.A, CH4 with -6446.16 Gg CO2 / year (-68.6%)
- 3: M.AG.ELV, N2O with -4131.56 Gg CO2 / year (-10.5%)
- 4: 4, CH4 with -3874.65 Gg CO2 / year (-27.1%)
- 5: M.AG.ELV, CH4 with -3386.56 Gg CO2 / year (-31.9%)
Changes in the main sectors for aggregate KyotoGHG (AR6GWP100) are
- 1: Total sectoral emissions in 2022 are 191104.08
Gg CO2 / year which is 39.6% of M.0.EL emissions. 2023 Emissions have
changed by -19.0% (-39608.78 Gg CO2
/ year). 1990-2023 Emissions have changed by -5.6% (-8764.08 Gg CO2 / year). For 2023
the changes per gas
are:
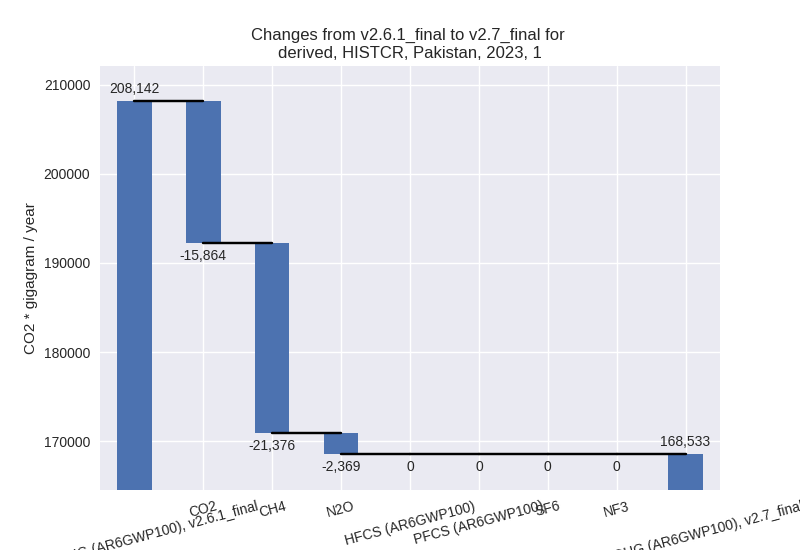
For 1990-2023 the changes per gas are: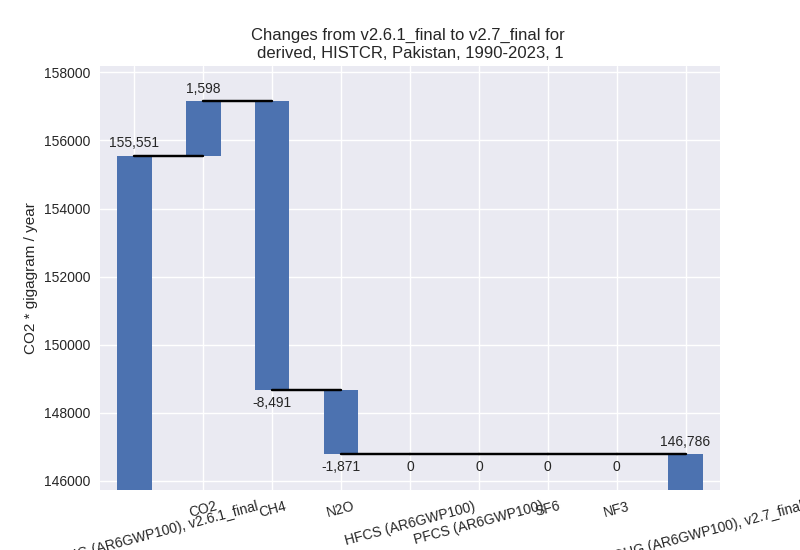
The changes come from the following subsectors:- 1.A: Total sectoral emissions in 2022 are 185915.05
Gg CO2 / year which is 97.3% of category 1 emissions. 2023 Emissions
have changed by -15.4% (-29717.17 Gg
CO2 / year). 1990-2023 Emissions have changed by -4.7% (-6719.01 Gg CO2 / year). For 2023
the changes per gas
are:
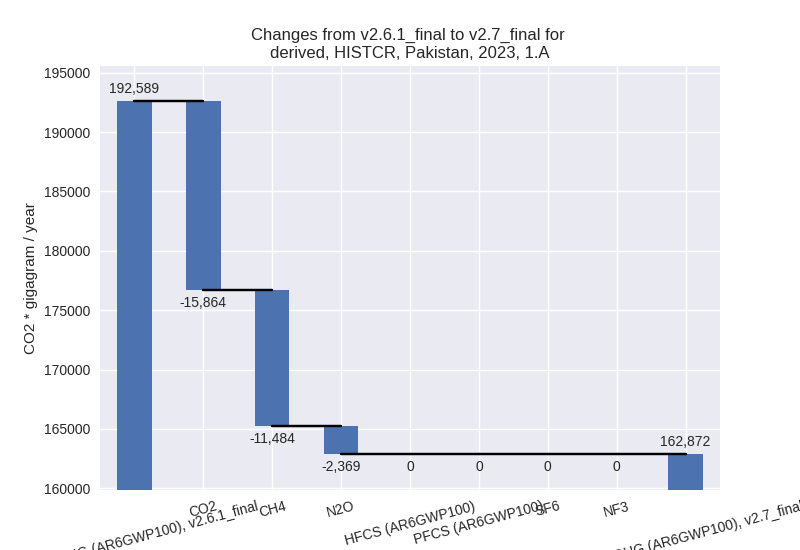
For 1990-2023 the changes per gas are: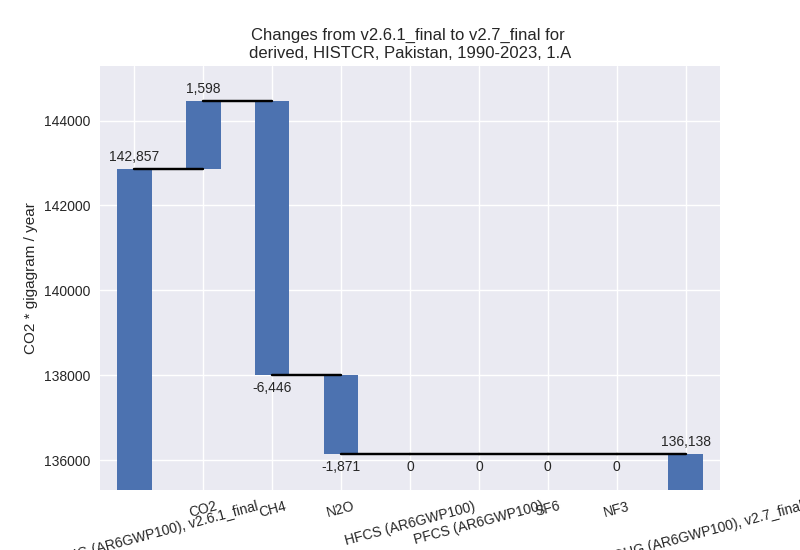
There is no subsector information available in PRIMAP-hist. - 1.B.1: Total sectoral emissions in 2022 are 1082.10
Gg CO2 / year which is 0.6% of category 1 emissions. 2023 Emissions have
changed by -70.5% (-3952.27 Gg CO2 /
year). 1990-2023 Emissions have changed by -22.9% (-484.49 Gg CO2 / year). For 2023
the changes per gas
are:
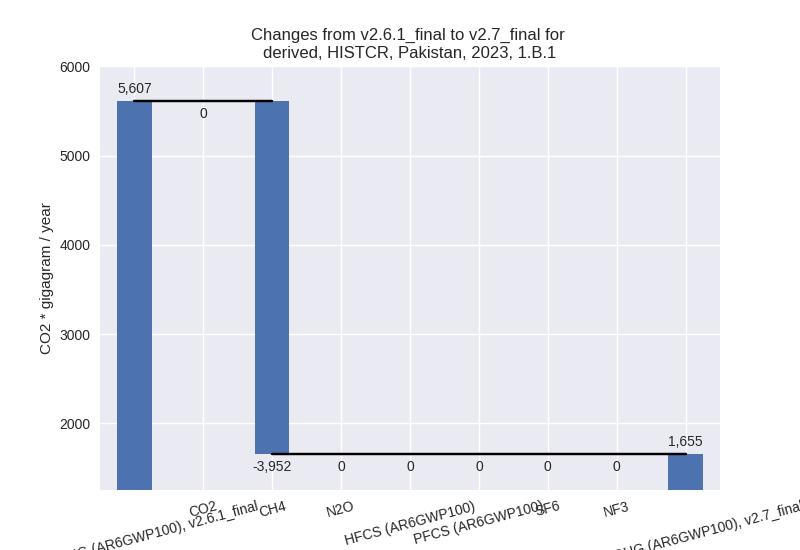
For 1990-2023 the changes per gas are: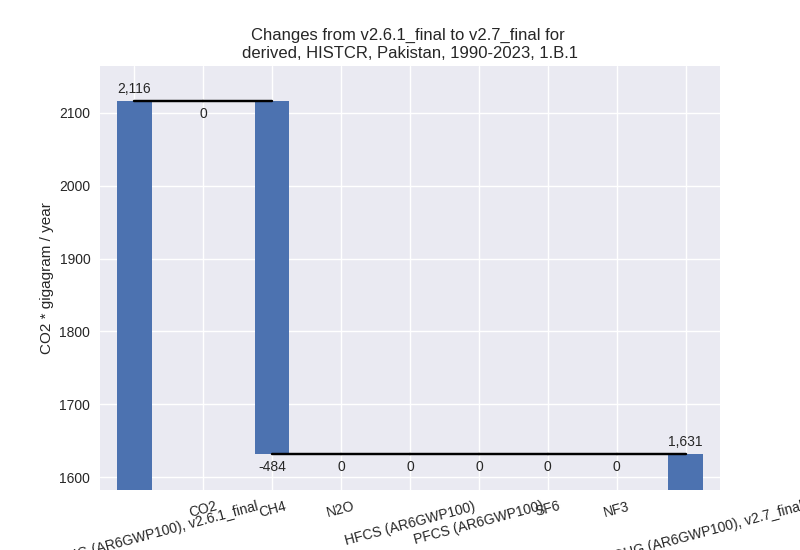
There is no subsector information available in PRIMAP-hist. - 1.B.2: Total sectoral emissions in 2022 are 4106.93
Gg CO2 / year which is 2.1% of category 1 emissions. 2023 Emissions have
changed by -59.7% (-5939.34 Gg CO2 /
year). 1990-2023 Emissions have changed by -14.8% (-1560.58 Gg CO2 / year). For 2023
the changes per gas
are:
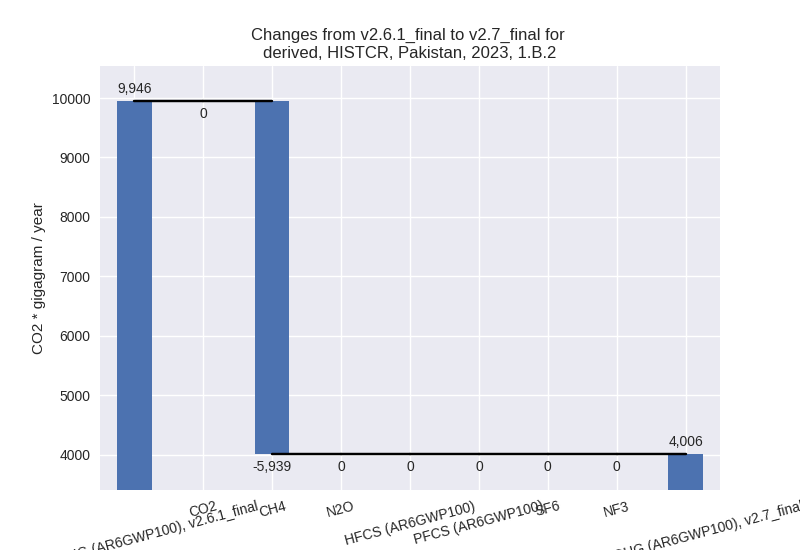
For 1990-2023 the changes per gas are: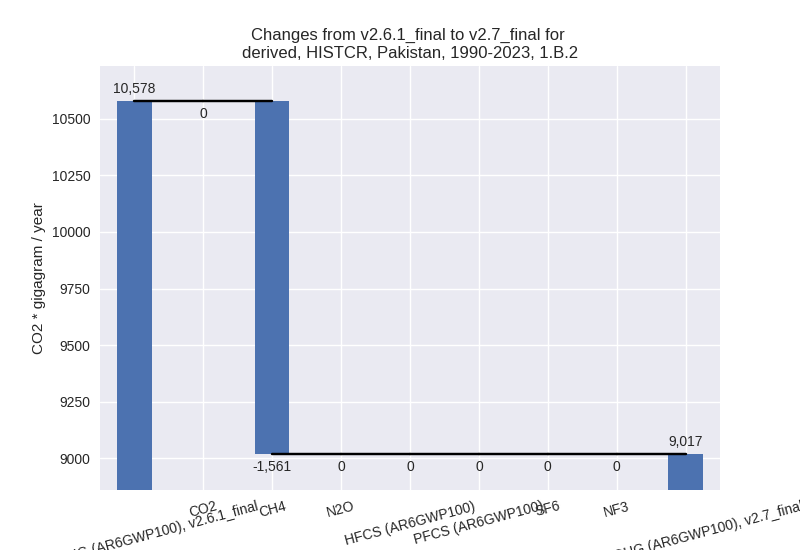
There is no subsector information available in PRIMAP-hist.
- 1.A: Total sectoral emissions in 2022 are 185915.05
Gg CO2 / year which is 97.3% of category 1 emissions. 2023 Emissions
have changed by -15.4% (-29717.17 Gg
CO2 / year). 1990-2023 Emissions have changed by -4.7% (-6719.01 Gg CO2 / year). For 2023
the changes per gas
are:
- 2: Total sectoral emissions in 2022 are 41476.50 Gg
CO2 / year which is 8.6% of M.0.EL emissions. 2023 Emissions have
changed by 15.4% (5674.81 Gg CO2 /
year). 1990-2023 Emissions have changed by 15.8% (2978.51 Gg CO2 / year). For 2023
the changes per gas
are:
For 1990-2023 the changes per gas are: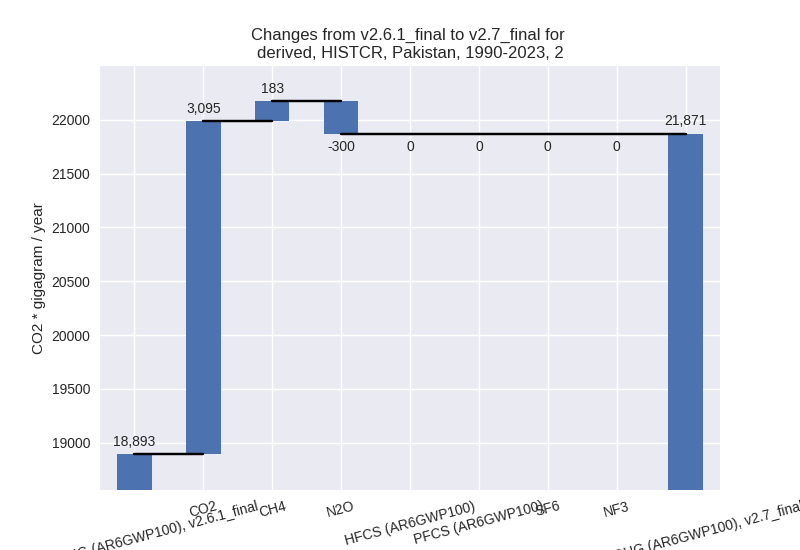
- M.AG: Total sectoral emissions in 2022 are
215088.58 Gg CO2 / year which is 44.6% of M.0.EL emissions. 2023
Emissions have changed by -6.6%
(-15751.39 Gg CO2 / year). 1990-2023 Emissions have changed by -8.4% (-12816.90 Gg CO2 / year). For 2023
the changes per gas
are:
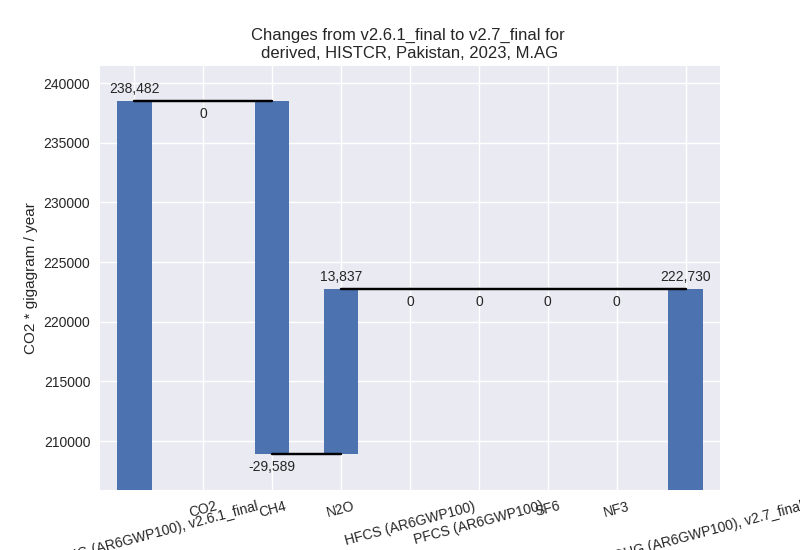
For 1990-2023 the changes per gas are: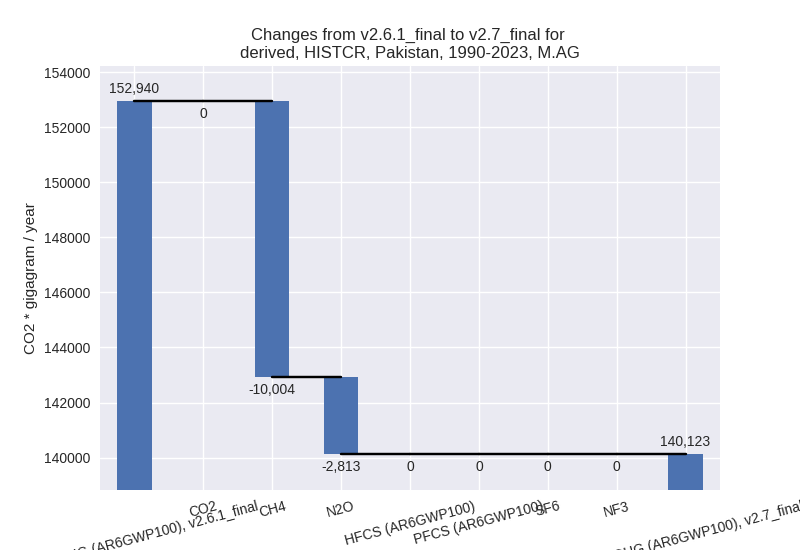
The changes come from the following subsectors:- 3.A: Total sectoral emissions in 2022 are 134254.06
Gg CO2 / year which is 62.4% of category M.AG emissions. 2023 Emissions
have changed by -12.9% (-20498.44 Gg
CO2 / year). 1990-2023 Emissions have changed by -5.4% (-5298.78 Gg CO2 / year). For 2023
the changes per gas
are:
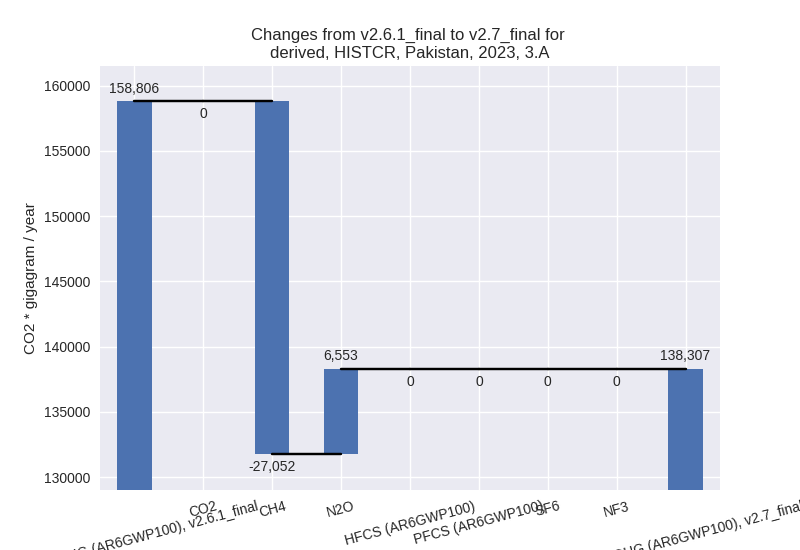
For 1990-2023 the changes per gas are: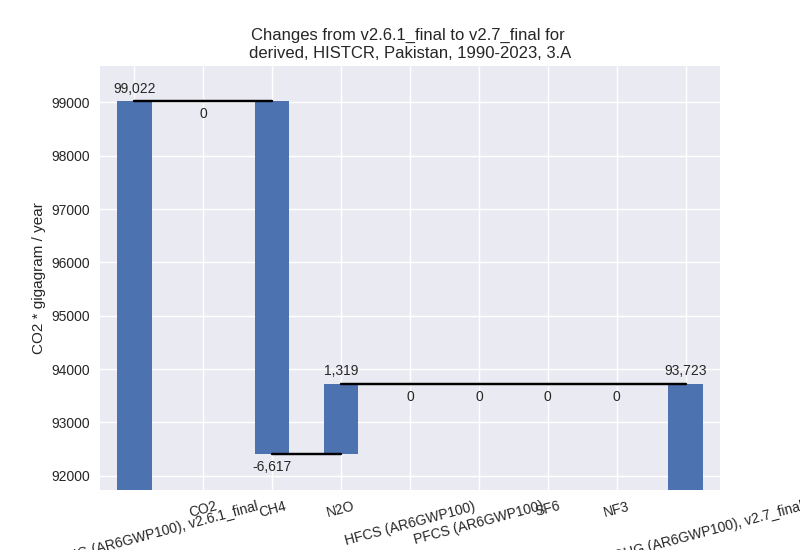
There is no subsector information available in PRIMAP-hist. - M.AG.ELV: Total sectoral emissions in 2022 are
80834.52 Gg CO2 / year which is 37.6% of category M.AG emissions. 2023
Emissions have changed by 6.0%
(4747.04 Gg CO2 / year). 1990-2023 Emissions have changed by -13.9% (-7518.12 Gg CO2 / year). For 2023
the changes per gas
are:
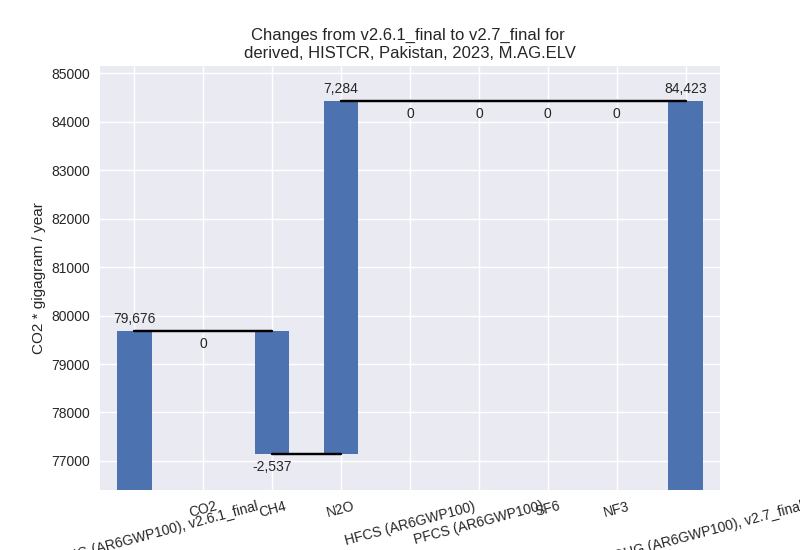
For 1990-2023 the changes per gas are: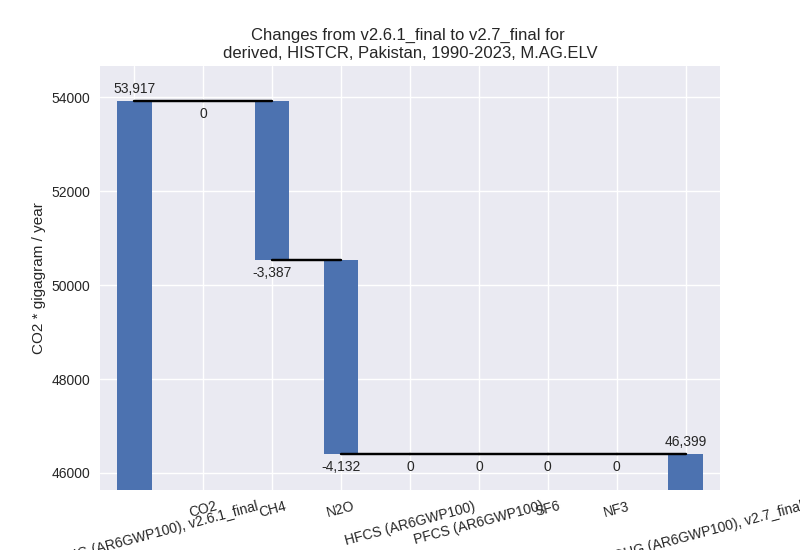
There is no subsector information available in PRIMAP-hist.
- 3.A: Total sectoral emissions in 2022 are 134254.06
Gg CO2 / year which is 62.4% of category M.AG emissions. 2023 Emissions
have changed by -12.9% (-20498.44 Gg
CO2 / year). 1990-2023 Emissions have changed by -5.4% (-5298.78 Gg CO2 / year). For 2023
the changes per gas
are:
- 4: Total sectoral emissions in 2022 are 32671.62 Gg
CO2 / year which is 6.8% of M.0.EL emissions. 2023 Emissions have
changed by 30.6% (7787.16 Gg CO2 /
year). 1990-2023 Emissions have changed by -24.7% (-3963.28 Gg CO2 / year). For 2023
the changes per gas
are:
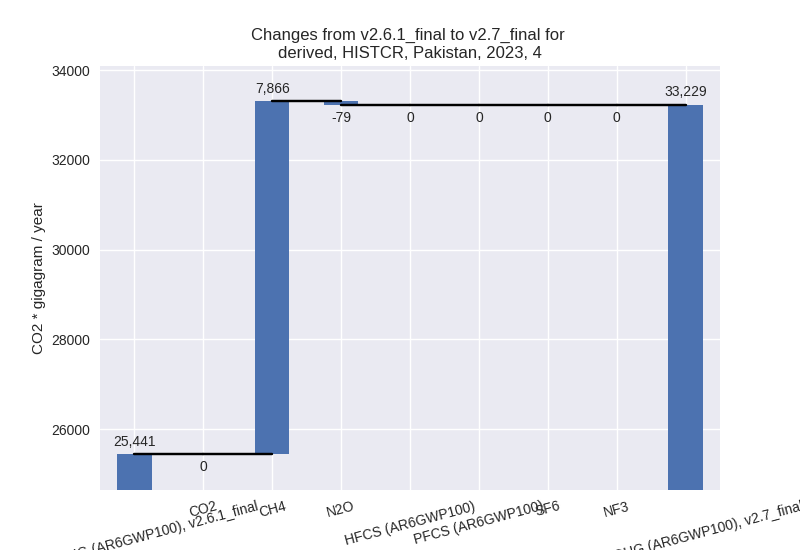
For 1990-2023 the changes per gas are: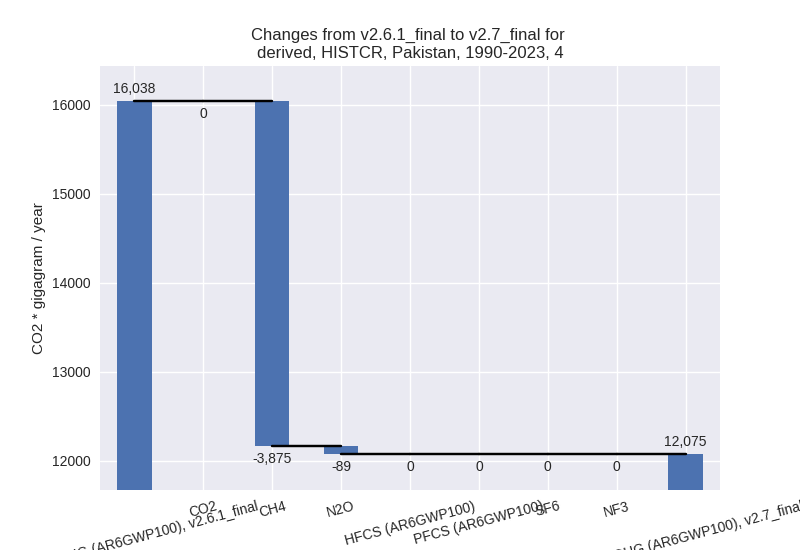
- 5: Total sectoral emissions in 2022 are 1913.94 Gg CO2 / year which is 0.4% of M.0.EL emissions. 2023 Emissions have changed by 0.0% (0.00 Gg CO2 / year). 1990-2023 Emissions have changed by 0.0% (0.00 Gg CO2 / year).
third party scenario (HISTTP):
Most important changes per time frame
For 2023 the following sector-gas combinations have the highest absolute impact on national total KyotoGHG (AR6GWP100) emissions in 2023 (top 5):
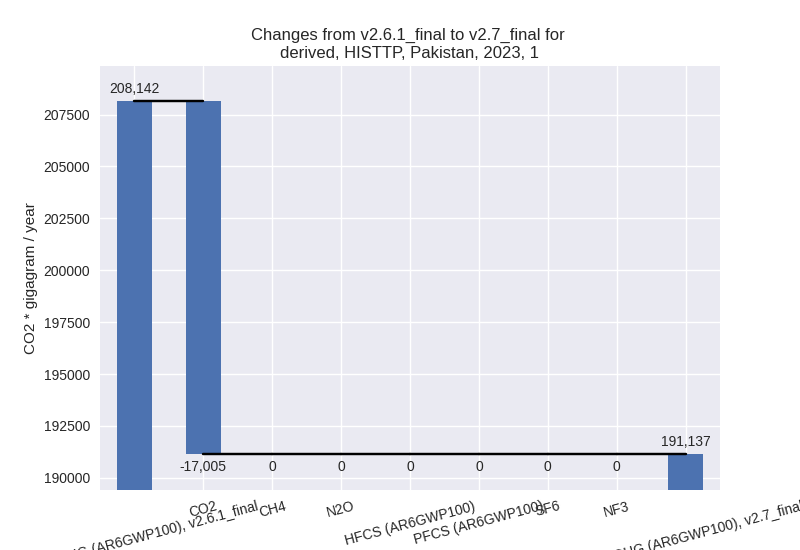
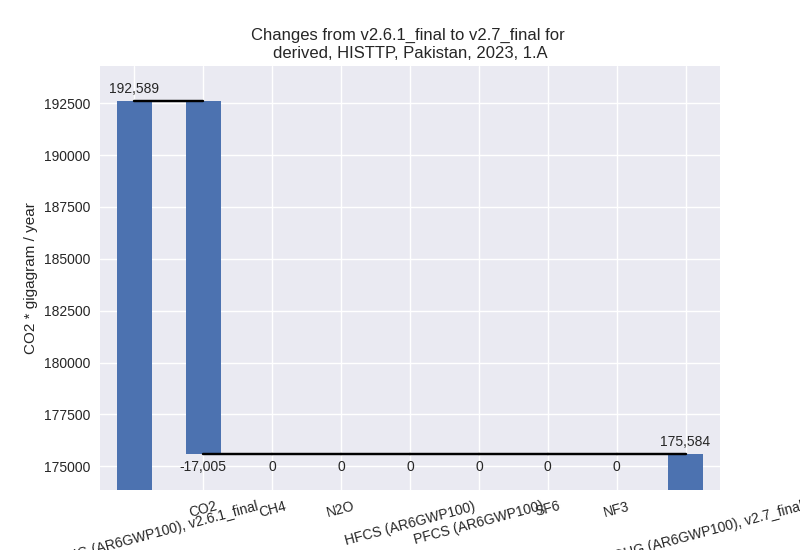
- 1: 1.A, CO2 with -17005.31 Gg CO2 / year (-9.6%)
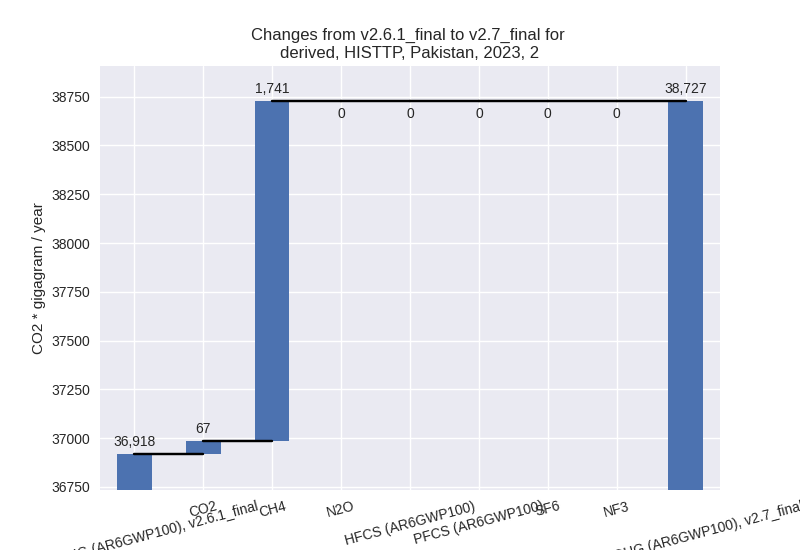
- 2: 2, CH4 with 1741.35 Gg CO2 / year (inf%)
- 3: 2, CO2 with 67.22 Gg CO2 / year (0.3%)
- 4: 1.A, CH4 with 0.00 Gg CO2 / year (0.0%)
- 5: 1.A, N2O with 0.00 Gg CO2 / year (0.0%)
For 1990-2023 the following sector-gas combinations have the highest absolute impact on national total KyotoGHG (AR6GWP100) emissions in 1990-2023 (top 5):
- 1: 1.A, CO2 with -1150.42 Gg CO2 / year (-0.9%)
- 2: 2, CH4 with 184.50 Gg CO2 / year (13298.7%)
- 3: 2, CO2 with 7.12 Gg CO2 / year (0.1%)
- 4: 1.A, CH4 with 0.00 Gg CO2 / year (0.0%)
- 5: 1.A, N2O with 0.00 Gg CO2 / year (0.0%)
Changes in the main sectors for aggregate KyotoGHG (AR6GWP100) are
- 1: Total sectoral emissions in 2022 are 212529.13
Gg CO2 / year which is 41.9% of M.0.EL emissions. 2023 Emissions have
changed by -8.2% (-17005.31 Gg CO2 /
year). 1990-2023 Emissions have changed by -0.7% (-1150.42 Gg CO2 / year). For 2023
the changes per gas
are:
The changes come from the following subsectors:- 1.A: Total sectoral emissions in 2022 are 198677.60
Gg CO2 / year which is 93.5% of category 1 emissions. 2023 Emissions
have changed by -8.8% (-17005.31 Gg
CO2 / year). 1990-2023 Emissions have changed by -0.8% (-1150.42 Gg CO2 / year). For 2023
the changes per gas
are:
There is no subsector information available in PRIMAP-hist. - 1.B.1: Total sectoral emissions in 2022 are 3672.07 Gg CO2 / year which is 1.7% of category 1 emissions. 2023 Emissions have changed by 0.0% (0.00 Gg CO2 / year). 1990-2023 Emissions have changed by 0.0% (0.00 Gg CO2 / year).
- 1.B.2: Total sectoral emissions in 2022 are 10179.46 Gg CO2 / year which is 4.8% of category 1 emissions. 2023 Emissions have changed by 0.0% (0.00 Gg CO2 / year). 1990-2023 Emissions have changed by 0.0% (0.00 Gg CO2 / year).
- 1.A: Total sectoral emissions in 2022 are 198677.60
Gg CO2 / year which is 93.5% of category 1 emissions. 2023 Emissions
have changed by -8.8% (-17005.31 Gg
CO2 / year). 1990-2023 Emissions have changed by -0.8% (-1150.42 Gg CO2 / year). For 2023
the changes per gas
are:
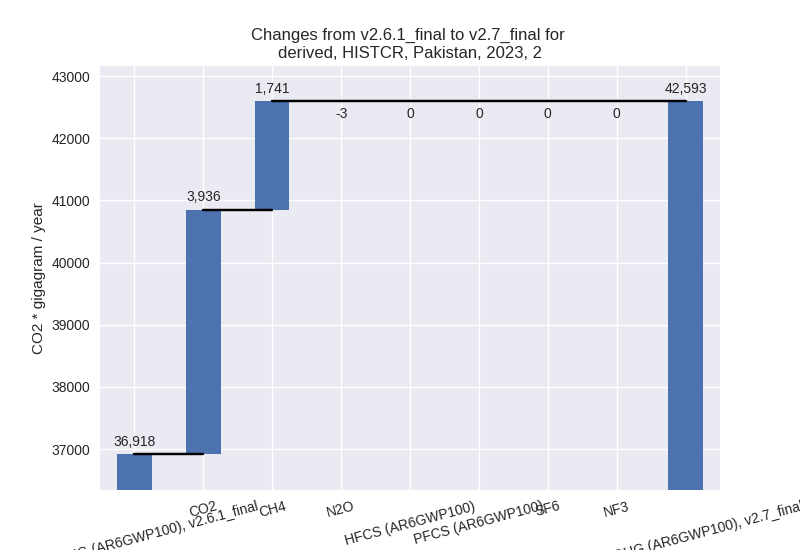
- 2: Total sectoral emissions in 2022 are 37633.05 Gg
CO2 / year which is 7.4% of M.0.EL emissions. 2023 Emissions have
changed by 4.9% (1808.56 Gg CO2 /
year). 1990-2023 Emissions have changed by 1.0% (191.62 Gg CO2 / year). For 2023 the
changes per gas
are:
- M.AG: Total sectoral emissions in 2022 are 230038.28 Gg CO2 / year which is 45.4% of M.0.EL emissions. 2023 Emissions have changed by 0.0% (0.00 Gg CO2 / year). 1990-2023 Emissions have changed by 0.0% (0.00 Gg CO2 / year).
- 4: Total sectoral emissions in 2022 are 25010.91 Gg CO2 / year which is 4.9% of M.0.EL emissions. 2023 Emissions have changed by 0.0% (0.00 Gg CO2 / year). 1990-2023 Emissions have changed by 0.0% (0.00 Gg CO2 / year).
- 5: Total sectoral emissions in 2022 are 1913.94 Gg CO2 / year which is 0.4% of M.0.EL emissions. 2023 Emissions have changed by 0.0% (0.00 Gg CO2 / year). 1990-2023 Emissions have changed by 0.0% (0.00 Gg CO2 / year).