Changes in PRIMAP-hist v2.7_final compared to v2.6.1_final for Sweden
2025-09-11
Johannes Gütschow
Change analysis for Sweden for PRIMAP-hist v2.7_final compared to v2.6.1_final
Overview over emissions by sector and gas
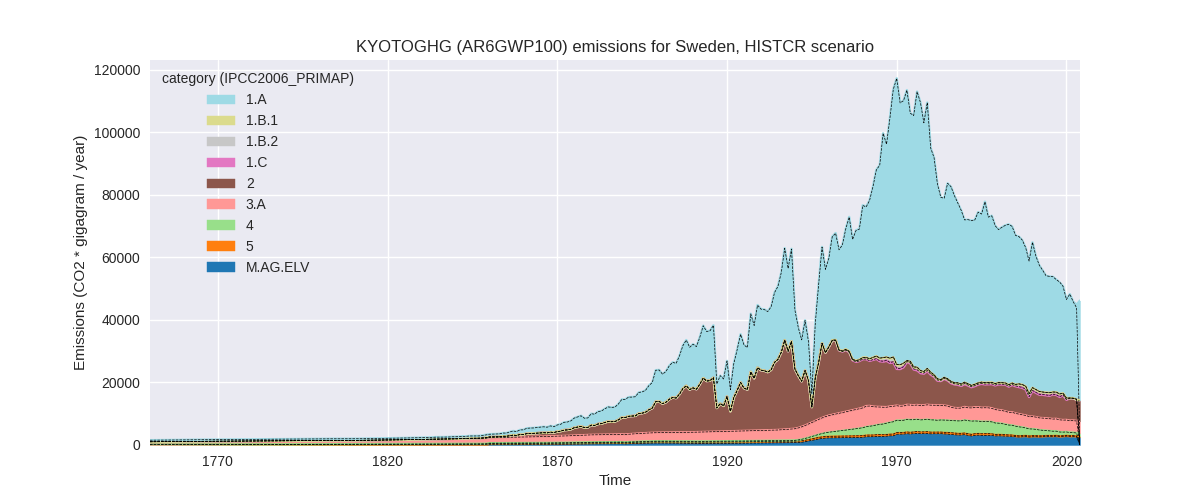
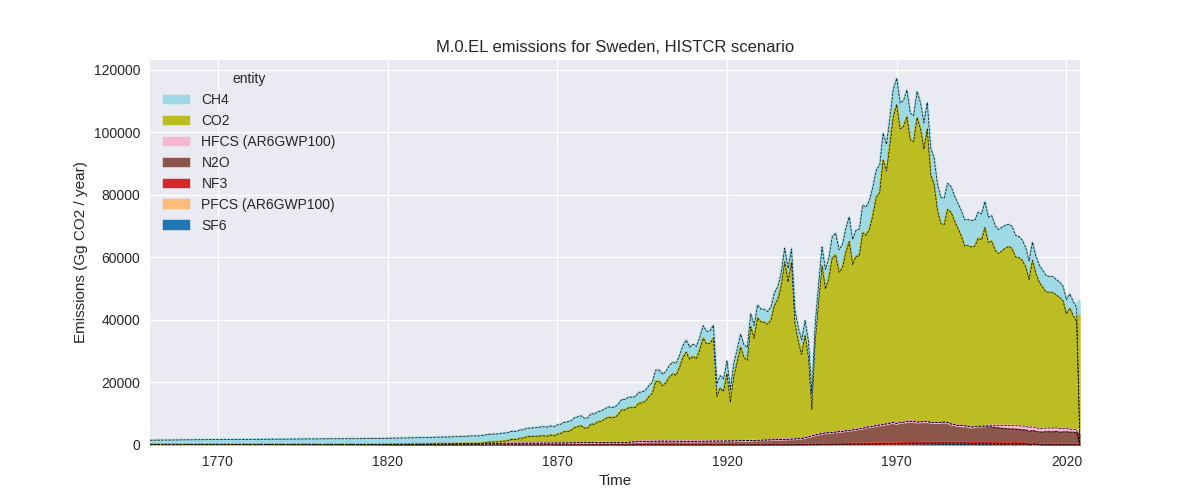
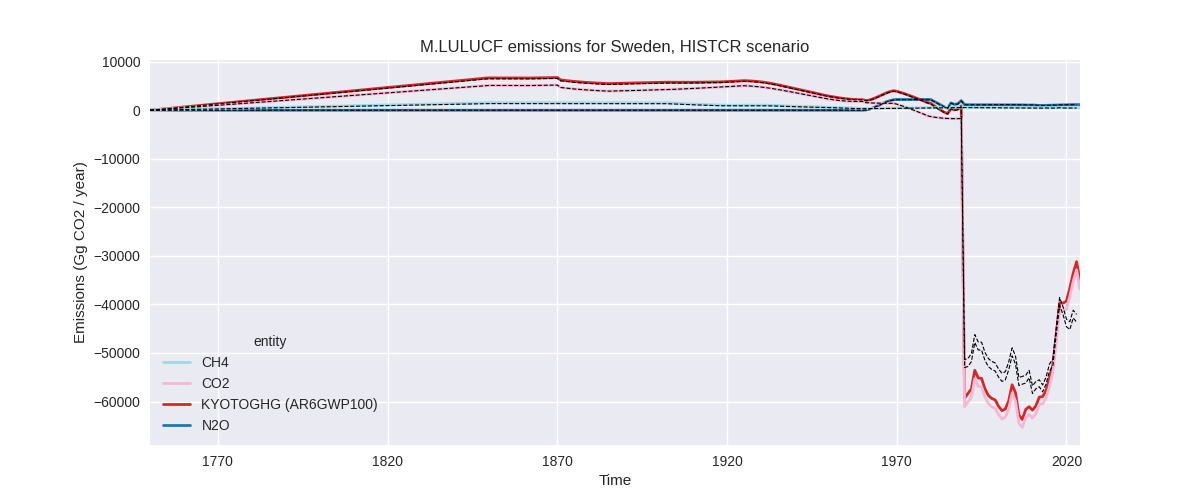
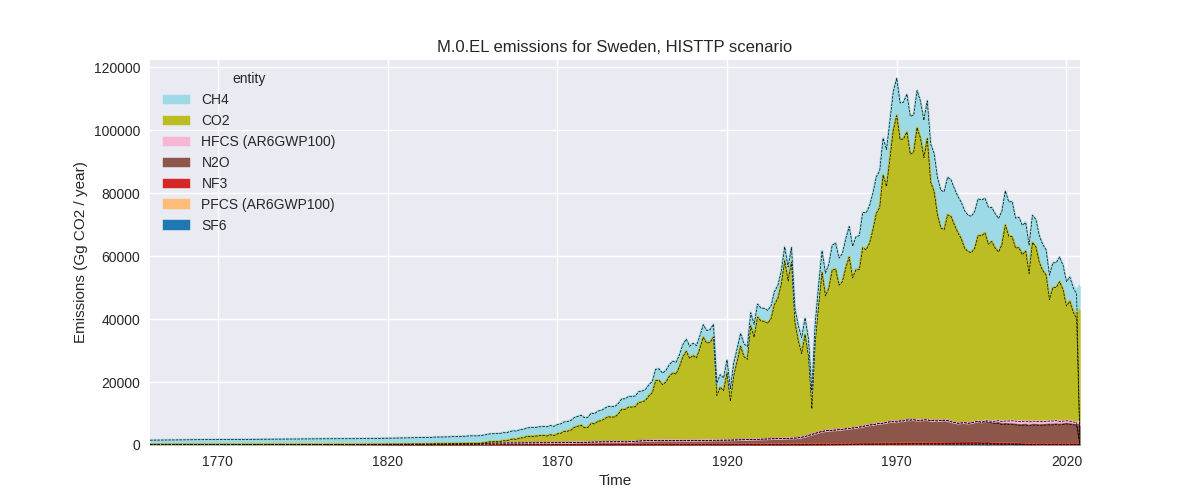
The following figures show the aggregate national total emissions excluding LULUCF AR6GWP100 for the country reported priority scenario. The dotted linesshow the v2.6.1_final data.
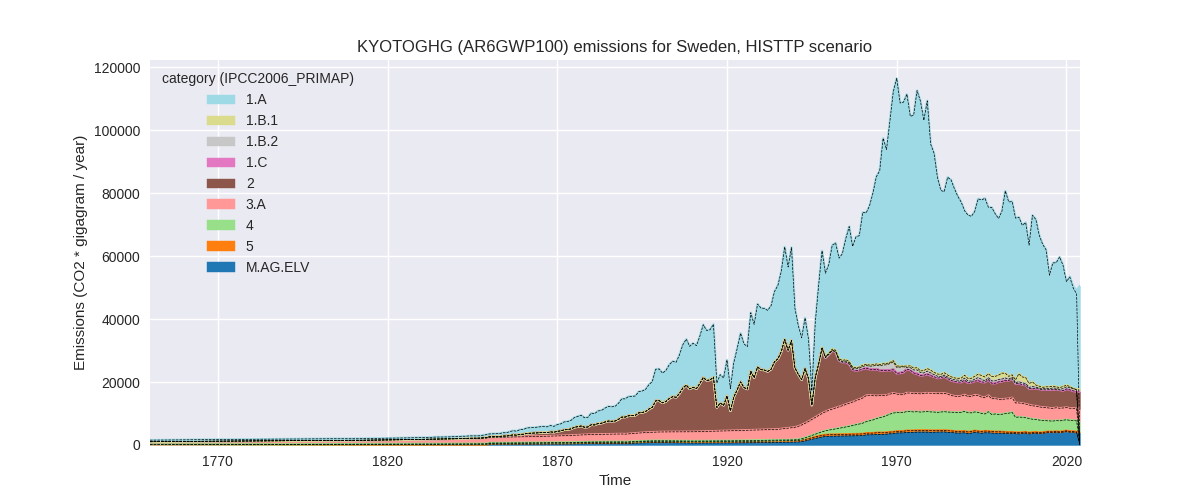
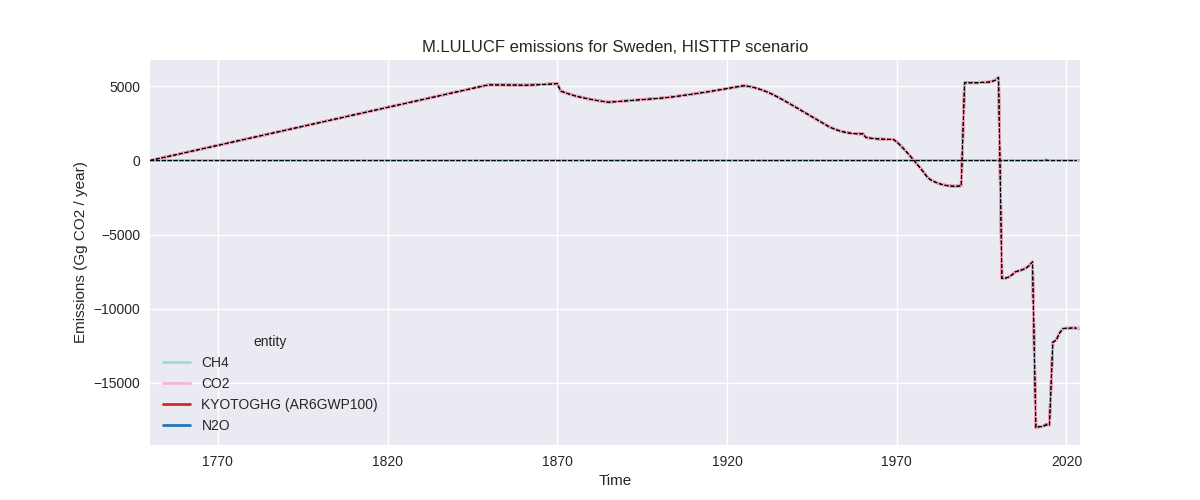
The following figures show the aggregate national total emissions excluding LULUCF AR6GWP100 for the third party priority scenario. The dotted linesshow the v2.6.1_final data.
Overview over changes
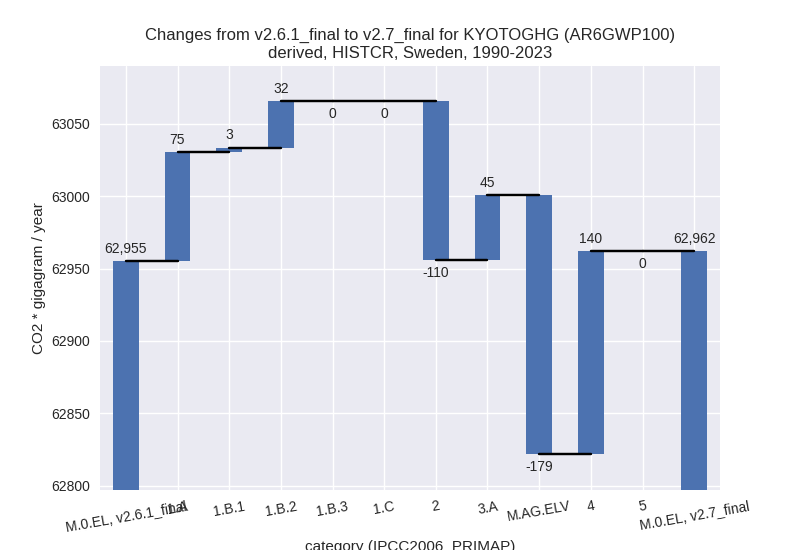
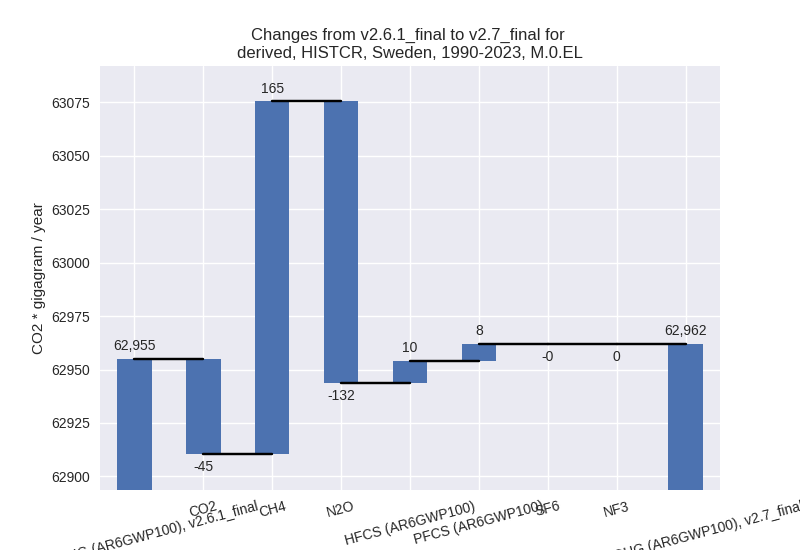
In the country reported priority scenario we have the following changes for aggregate Kyoto GHG and national total emissions excluding LULUCF (M.0.EL):
- Emissions in 2023 have changed by 2.2%% (986.65 Gg CO2 / year)
- Emissions in 1990-2023 have changed by 0.0%% (7.09 Gg CO2 / year)
In the third party priority scenario we have the following changes for aggregate Kyoto GHG and national total emissions excluding LULUCF (M.0.EL):
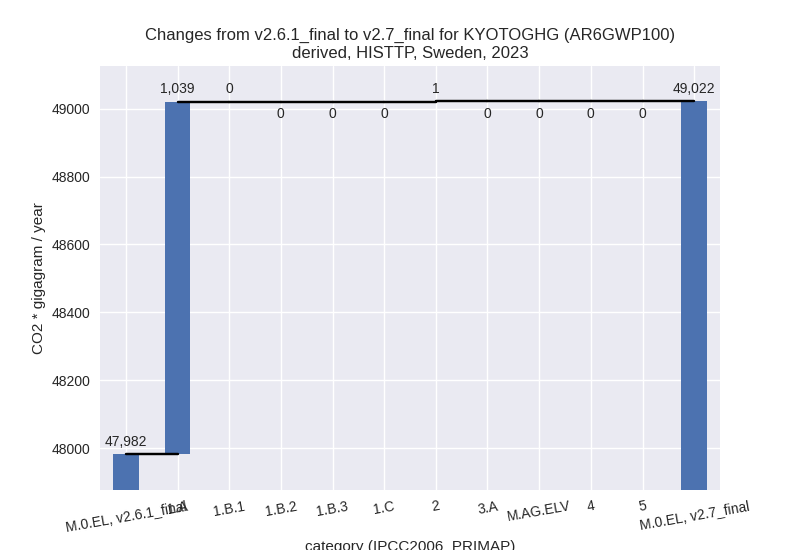
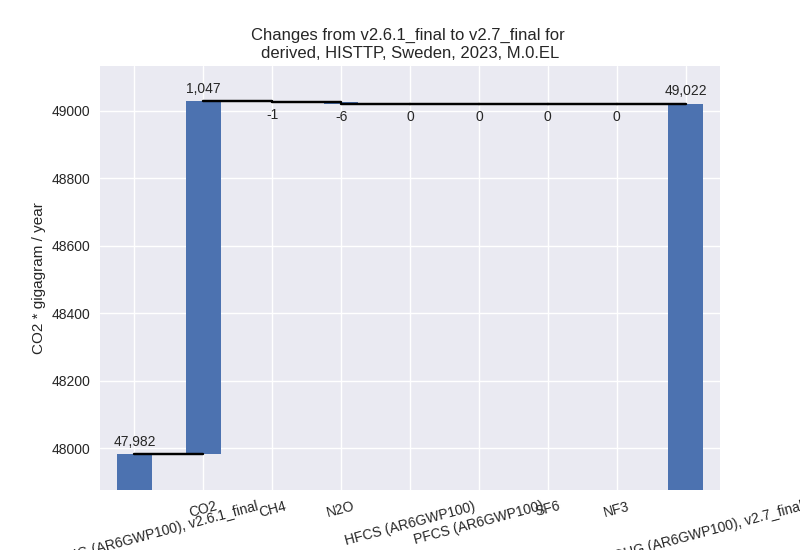
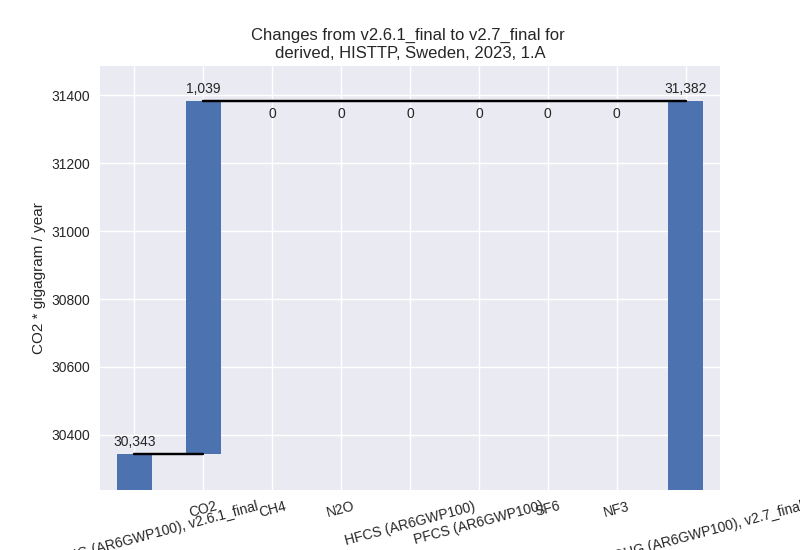
- Emissions in 2023 have changed by 2.2%% (1039.90 Gg CO2 / year)
- Emissions in 1990-2023 have changed by 0.1%% (58.23 Gg CO2 / year)
Most important changes per scenario and time frame
In the country reported priority scenario the following sector-gas combinations have the highest absolute impact on national total KyotoGHG (AR6GWP100) emissions in 2023 (top 5):
- 1: 1.A, CO2 with 1184.91 Gg CO2 / year (4.2%)
- 2: 2, CO2 with -177.15 Gg CO2 / year (-3.1%)
- 3: M.AG.ELV, N2O with -151.00 Gg CO2 / year (-6.0%)
- 4: 4, CH4 with 111.16 Gg CO2 / year (17.9%)
- 5: 3.A, CH4 with 39.23 Gg CO2 / year (1.1%)
In the country reported priority scenario the following sector-gas combinations have the highest absolute impact on national total KyotoGHG (AR6GWP100) emissions in 1990-2023 (top 5):
- 1: M.AG.ELV, N2O with -168.78 Gg CO2 / year (-6.3%)
- 2: 4, CH4 with 140.49 Gg CO2 / year (6.0%)
- 3: 2, CO2 with -127.94 Gg CO2 / year (-2.1%)
- 4: 1.A, CO2 with 80.12 Gg CO2 / year (0.2%)
- 5: 3.A, N2O with 41.52 Gg CO2 / year (17.5%)
In the third party priority scenario the following sector-gas combinations have the highest absolute impact on national total KyotoGHG (AR6GWP100) emissions in 2023 (top 5):
- 1: 1.A, CO2 with 1039.09 Gg CO2 / year (3.6%)
- 2: 2, CO2 with 7.70 Gg CO2 / year (0.2%)
- 3: 2, N2O with -6.03 Gg CO2 / year (-1.0%)
- 4: 2, CH4 with -0.90 Gg CO2 / year (-4.1%)
- 5: 1.B.1, N2O with 0.04 Gg CO2 / year (677.7%)
In the third party priority scenario the following sector-gas combinations have the highest absolute impact on national total KyotoGHG (AR6GWP100) emissions in 1990-2023 (top 5):
- 1: 1.A, CO2 with 49.51 Gg CO2 / year (0.1%)
- 2: 2, CO2 with 8.89 Gg CO2 / year (0.2%)
- 3: 2, N2O with -0.18 Gg CO2 / year (-0.0%)
- 4: 1.B.1, N2O with 0.04 Gg CO2 / year (948.4%)
- 5: 2, CH4 with -0.03 Gg CO2 / year (-0.2%)
Notes on data changes
Here we list notes explaining important emissions changes for the country.
- Data from BTR1 has been replaced by data from the 2025 National
Inventory Submission. This leads to changes in several sectors and gases
which are small in terms of total emissions.
- The main change for 2023 is a 4.2% increase in energy CO2 emissions where 2023 growth rates in the CR data are higher than the growth rates in EI 2024 used for extrapolation in PRIMAP-hist v2.6.1
- 2023 emissions for IPPU have changed because data based on extrapolation with third party growth rates has been replaced by country reported data.
- N2O from M.AG.ELV is lower for all years because some emissions factors for agricultural soil emissions have changed.
- Changes in the TP scenario are mostly for 2023l and mainly come from the updated EI data for energy CO2.
Changes by sector and gas
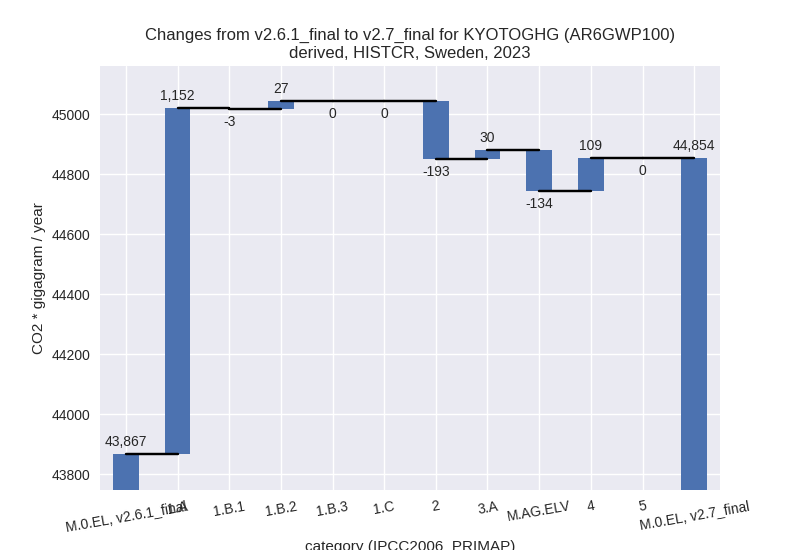
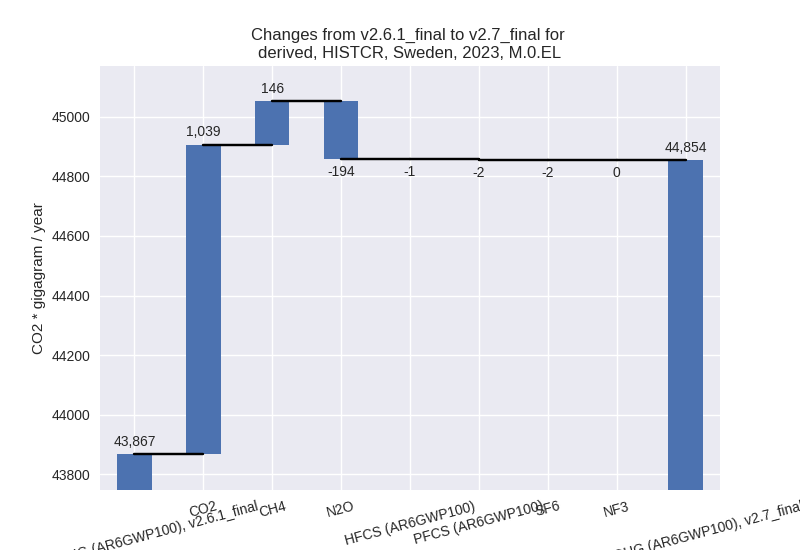
For each scenario and time frame the changes are displayed for all individual sectors and all individual gases. In the sector plot we use aggregate Kyoto GHGs in AR6GWP100. In the gas plot we usenational total emissions without LULUCF.
country reported scenario
2023
1990-2023
third party scenario
2023
1990-2023
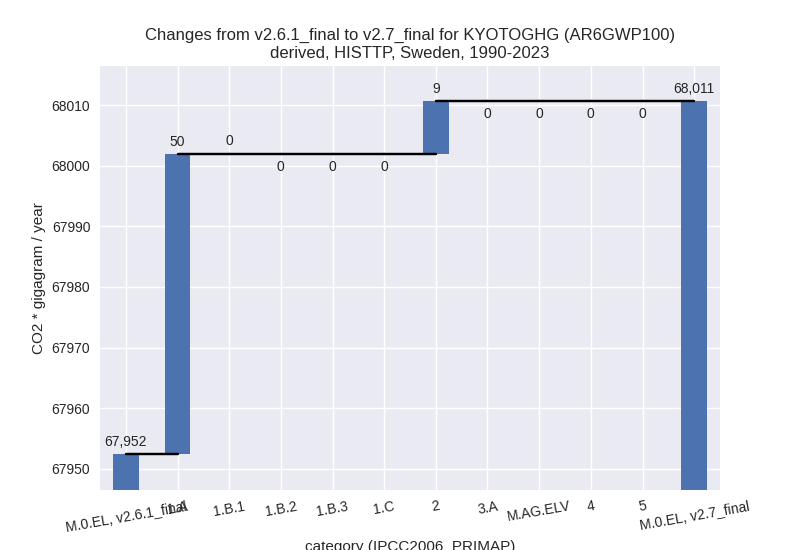
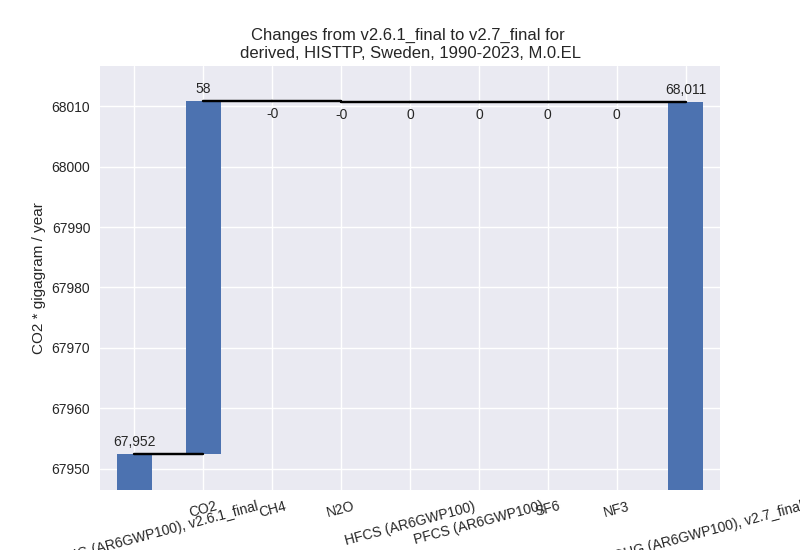
Detailed changes for the scenarios:
country reported scenario (HISTCR):
Most important changes per time frame
For 2023 the following sector-gas combinations have the highest absolute impact on national total KyotoGHG (AR6GWP100) emissions in 2023 (top 5):
- 1: 1.A, CO2 with 1184.91 Gg CO2 / year (4.2%)
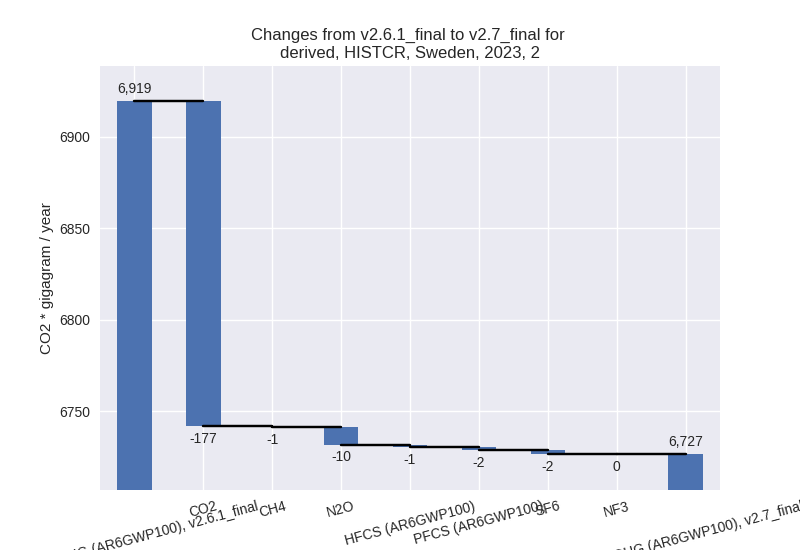
- 2: 2, CO2 with -177.15 Gg CO2 / year (-3.1%)
- 3: M.AG.ELV, N2O with -151.00 Gg CO2 / year (-6.0%)
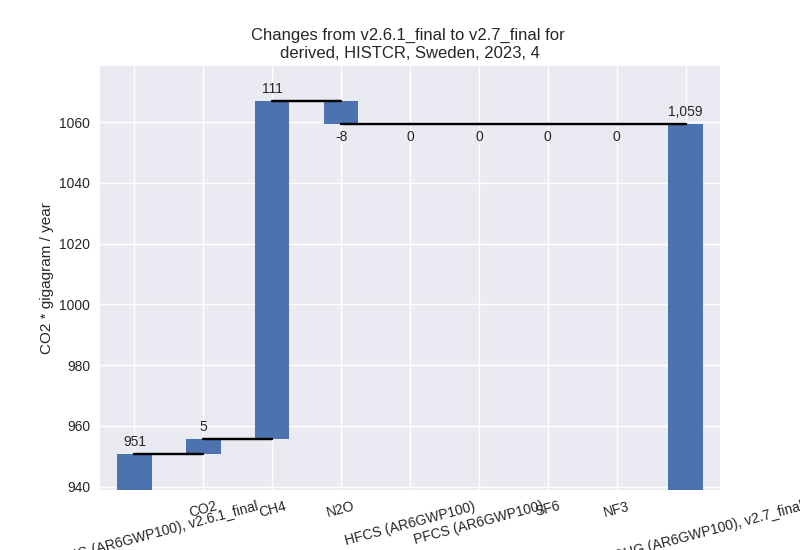
- 4: 4, CH4 with 111.16 Gg CO2 / year (17.9%)
- 5: 3.A, CH4 with 39.23 Gg CO2 / year (1.1%)
For 1990-2023 the following sector-gas combinations have the highest absolute impact on national total KyotoGHG (AR6GWP100) emissions in 1990-2023 (top 5):
- 1: M.AG.ELV, N2O with -168.78 Gg CO2 / year (-6.3%)
- 2: 4, CH4 with 140.49 Gg CO2 / year (6.0%)
- 3: 2, CO2 with -127.94 Gg CO2 / year (-2.1%)
- 4: 1.A, CO2 with 80.12 Gg CO2 / year (0.2%)
- 5: 3.A, N2O with 41.52 Gg CO2 / year (17.5%)
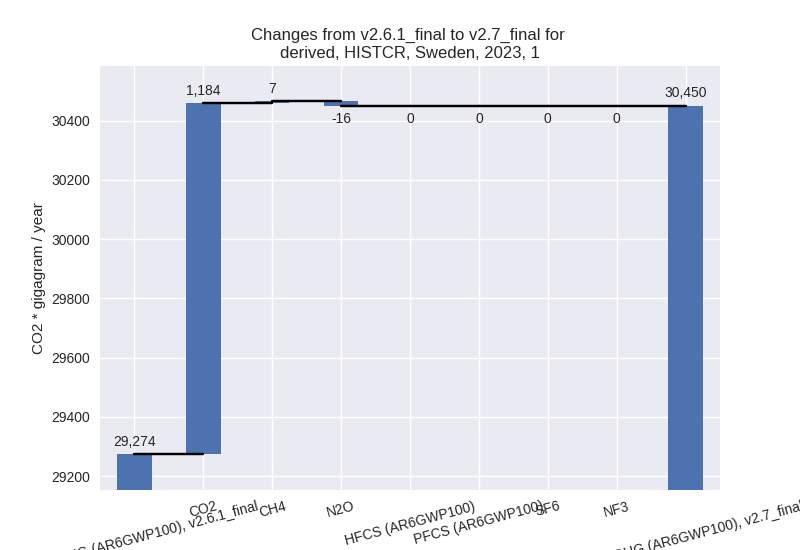
Changes in the main sectors for aggregate KyotoGHG (AR6GWP100) are
- 1: Total sectoral emissions in 2022 are 30858.71 Gg
CO2 / year which is 67.4% of M.0.EL emissions. 2023 Emissions have
changed by 4.0% (1175.51 Gg CO2 /
year). 1990-2023 Emissions have changed by 0.2% (110.54 Gg CO2 / year). For 2023 the
changes per gas
are:
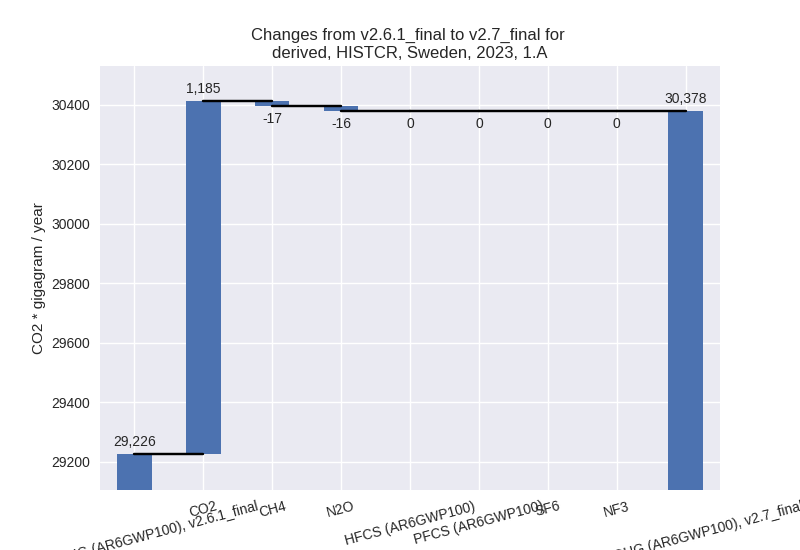
The changes come from the following subsectors:- 1.A: Total sectoral emissions in 2022 are 30779.27
Gg CO2 / year which is 99.7% of category 1 emissions. 2023 Emissions
have changed by 3.9% (1151.91 Gg CO2
/ year). 1990-2023 Emissions have changed by 0.2% (75.34 Gg CO2 / year). For 2023 the
changes per gas
are:
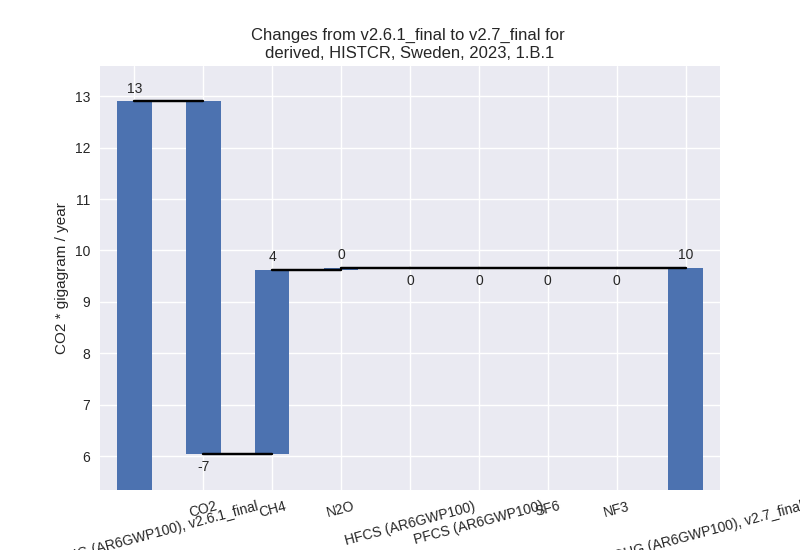
There is no subsector information available in PRIMAP-hist. - 1.B.1: Total sectoral emissions in 2022 are 15.44
Gg CO2 / year which is 0.1% of category 1 emissions. 2023 Emissions have
changed by -25.1% (-3.24 Gg CO2 /
year). 1990-2023 Emissions have changed by 46.0% (3.24 Gg CO2 / year). For 2023 the
changes per gas
are:
For 1990-2023 the changes per gas are: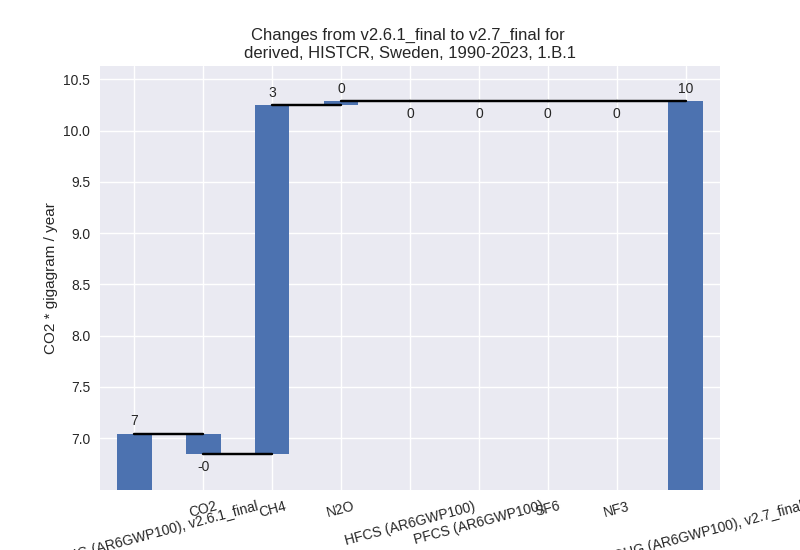
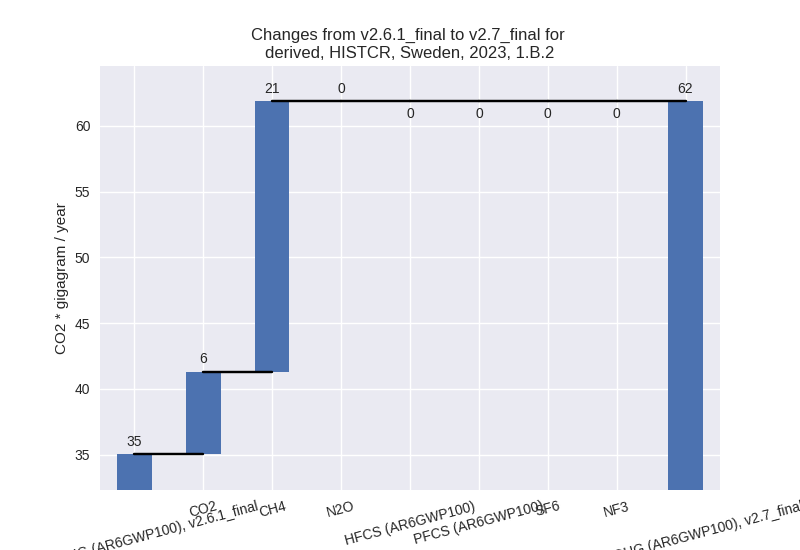
There is no subsector information available in PRIMAP-hist. - 1.B.2: Total sectoral emissions in 2022 are 64.00
Gg CO2 / year which is 0.2% of category 1 emissions. 2023 Emissions have
changed by 76.6% (26.84 Gg CO2 /
year). 1990-2023 Emissions have changed by 5.6% (31.97 Gg CO2 / year). For 2023 the
changes per gas
are:
For 1990-2023 the changes per gas are: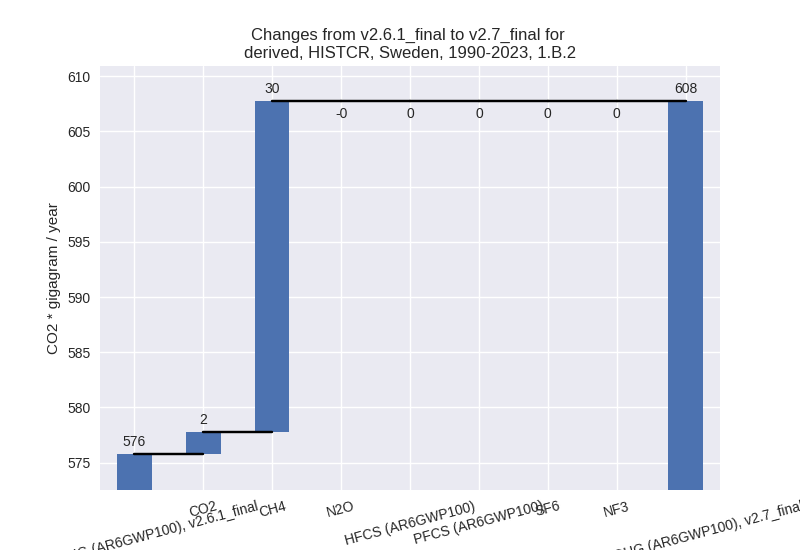
There is no subsector information available in PRIMAP-hist.
- 1.A: Total sectoral emissions in 2022 are 30779.27
Gg CO2 / year which is 99.7% of category 1 emissions. 2023 Emissions
have changed by 3.9% (1151.91 Gg CO2
/ year). 1990-2023 Emissions have changed by 0.2% (75.34 Gg CO2 / year). For 2023 the
changes per gas
are:
- 2: Total sectoral emissions in 2022 are 7098.67 Gg
CO2 / year which is 15.5% of M.0.EL emissions. 2023 Emissions have
changed by -2.8% (-192.72 Gg CO2 /
year). 1990-2023 Emissions have changed by -1.4% (-109.98 Gg CO2 / year). For 2023
the changes per gas
are:
- M.AG: Total sectoral emissions in 2022 are 6477.83 Gg CO2 / year which is 14.1% of M.0.EL emissions. 2023 Emissions have changed by -1.6% (-104.65 Gg CO2 / year). 1990-2023 Emissions have changed by -1.9% (-133.85 Gg CO2 / year).
- 4: Total sectoral emissions in 2022 are 1106.57 Gg
CO2 / year which is 2.4% of M.0.EL emissions. 2023 Emissions have
changed by 11.4% (108.51 Gg CO2 /
year). 1990-2023 Emissions have changed by 5.3% (140.38 Gg CO2 / year). For 2023 the
changes per gas
are:
For 1990-2023 the changes per gas are: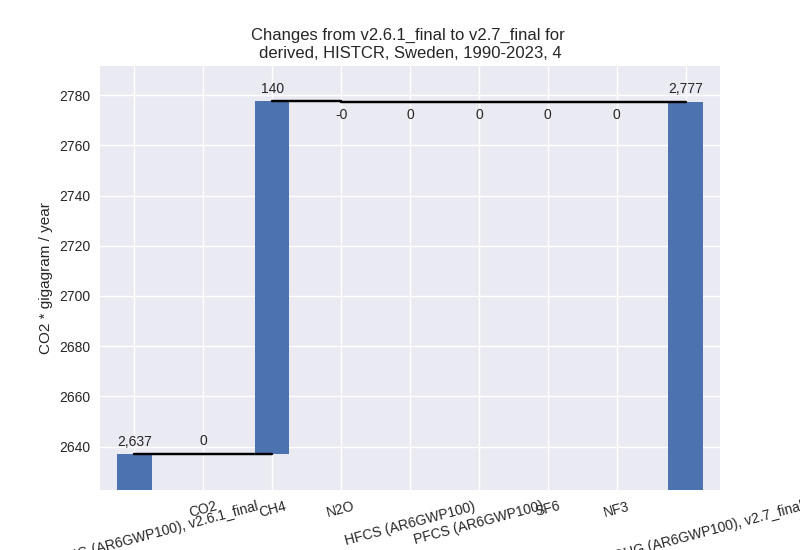
- 5: Total sectoral emissions in 2022 are 243.81 Gg CO2 / year which is 0.5% of M.0.EL emissions. 2023 Emissions have changed by 0.0% (0.00 Gg CO2 / year). 1990-2023 Emissions have changed by 0.0% (0.00 Gg CO2 / year).
third party scenario (HISTTP):
Most important changes per time frame
For 2023 the following sector-gas combinations have the highest absolute impact on national total KyotoGHG (AR6GWP100) emissions in 2023 (top 5):
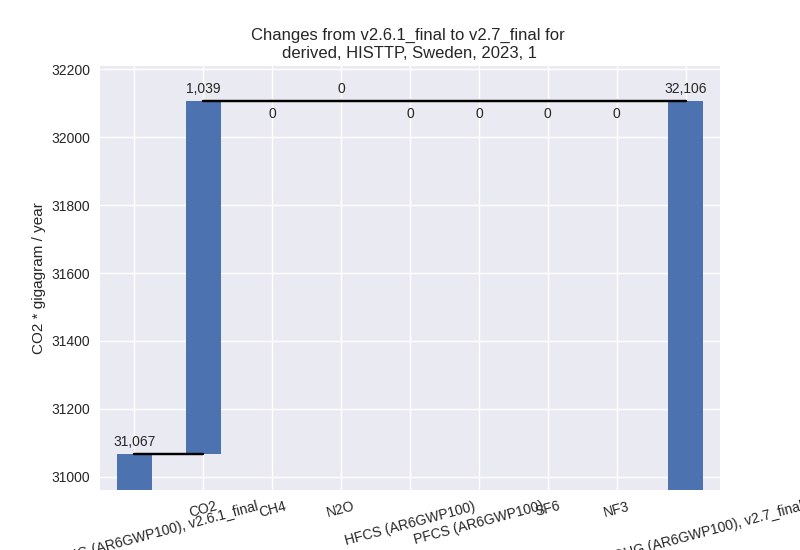
- 1: 1.A, CO2 with 1039.09 Gg CO2 / year (3.6%)
- 2: 2, CO2 with 7.70 Gg CO2 / year (0.2%)
- 3: 2, N2O with -6.03 Gg CO2 / year (-1.0%)
- 4: 2, CH4 with -0.90 Gg CO2 / year (-4.1%)
- 5: 1.B.1, N2O with 0.04 Gg CO2 / year (677.7%)
For 1990-2023 the following sector-gas combinations have the highest absolute impact on national total KyotoGHG (AR6GWP100) emissions in 1990-2023 (top 5):
- 1: 1.A, CO2 with 49.51 Gg CO2 / year (0.1%)
- 2: 2, CO2 with 8.89 Gg CO2 / year (0.2%)
- 3: 2, N2O with -0.18 Gg CO2 / year (-0.0%)
- 4: 1.B.1, N2O with 0.04 Gg CO2 / year (948.4%)
- 5: 2, CH4 with -0.03 Gg CO2 / year (-0.2%)
Changes in the main sectors for aggregate KyotoGHG (AR6GWP100) are
- 1: Total sectoral emissions in 2022 are 33165.38 Gg
CO2 / year which is 65.8% of M.0.EL emissions. 2023 Emissions have
changed by 3.3% (1039.13 Gg CO2 /
year). 1990-2023 Emissions have changed by 0.1% (49.55 Gg CO2 / year). For 2023 the
changes per gas
are:
The changes come from the following subsectors:- 1.A: Total sectoral emissions in 2022 are 32485.99
Gg CO2 / year which is 98.0% of category 1 emissions. 2023 Emissions
have changed by 3.4% (1039.09 Gg CO2
/ year). 1990-2023 Emissions have changed by 0.1% (49.51 Gg CO2 / year). For 2023 the
changes per gas
are:
There is no subsector information available in PRIMAP-hist. - 1.B.1: Total sectoral emissions in 2022 are 65.64 Gg CO2 / year which is 0.2% of category 1 emissions. 2023 Emissions have changed by 0.1% (0.04 Gg CO2 / year). 1990-2023 Emissions have changed by 0.0% (0.04 Gg CO2 / year).
- 1.B.2: Total sectoral emissions in 2022 are 613.75 Gg CO2 / year which is 1.9% of category 1 emissions. 2023 Emissions have changed by 0.0% (0.00 Gg CO2 / year). 1990-2023 Emissions have changed by 0.0% (0.00 Gg CO2 / year).
- 1.A: Total sectoral emissions in 2022 are 32485.99
Gg CO2 / year which is 98.0% of category 1 emissions. 2023 Emissions
have changed by 3.4% (1039.09 Gg CO2
/ year). 1990-2023 Emissions have changed by 0.1% (49.51 Gg CO2 / year). For 2023 the
changes per gas
are:
- 2: Total sectoral emissions in 2022 are 5593.25 Gg CO2 / year which is 11.1% of M.0.EL emissions. 2023 Emissions have changed by 0.0% (0.77 Gg CO2 / year). 1990-2023 Emissions have changed by 0.2% (8.68 Gg CO2 / year).
- M.AG: Total sectoral emissions in 2022 are 7938.54 Gg CO2 / year which is 15.7% of M.0.EL emissions. 2023 Emissions have changed by 0.0% (0.00 Gg CO2 / year). 1990-2023 Emissions have changed by 0.0% (0.00 Gg CO2 / year).
- 4: Total sectoral emissions in 2022 are 3500.53 Gg CO2 / year which is 6.9% of M.0.EL emissions. 2023 Emissions have changed by 0.0% (0.00 Gg CO2 / year). 1990-2023 Emissions have changed by 0.0% (0.00 Gg CO2 / year).
- 5: Total sectoral emissions in 2022 are 243.81 Gg CO2 / year which is 0.5% of M.0.EL emissions. 2023 Emissions have changed by 0.0% (0.00 Gg CO2 / year). 1990-2023 Emissions have changed by 0.0% (0.00 Gg CO2 / year).