Changes in PRIMAP-hist v2.7_final compared to v2.6.1_final for United States
2025-09-11
Johannes Gütschow
Change analysis for United States for PRIMAP-hist v2.7_final compared to v2.6.1_final
Overview over emissions by sector and gas
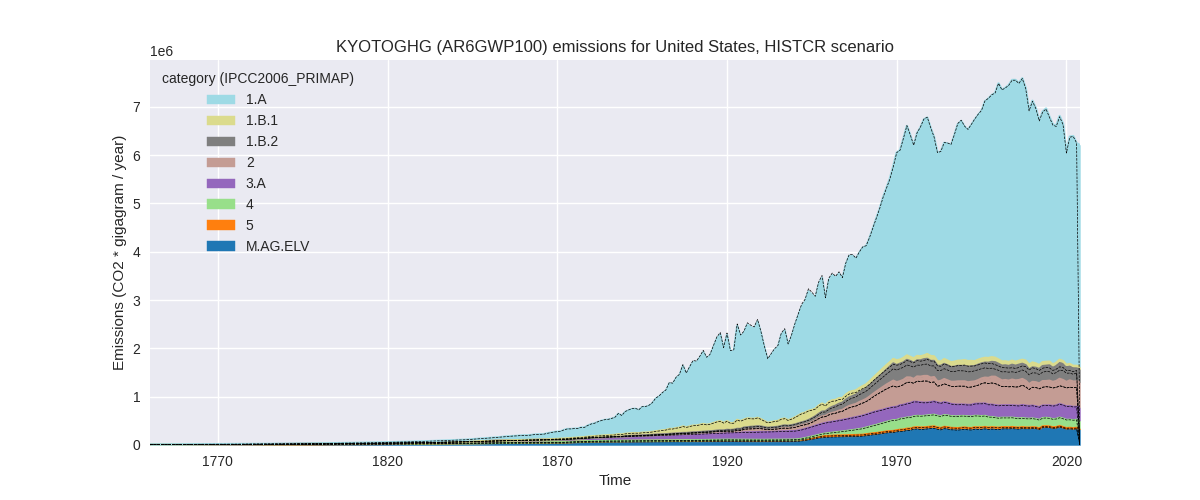
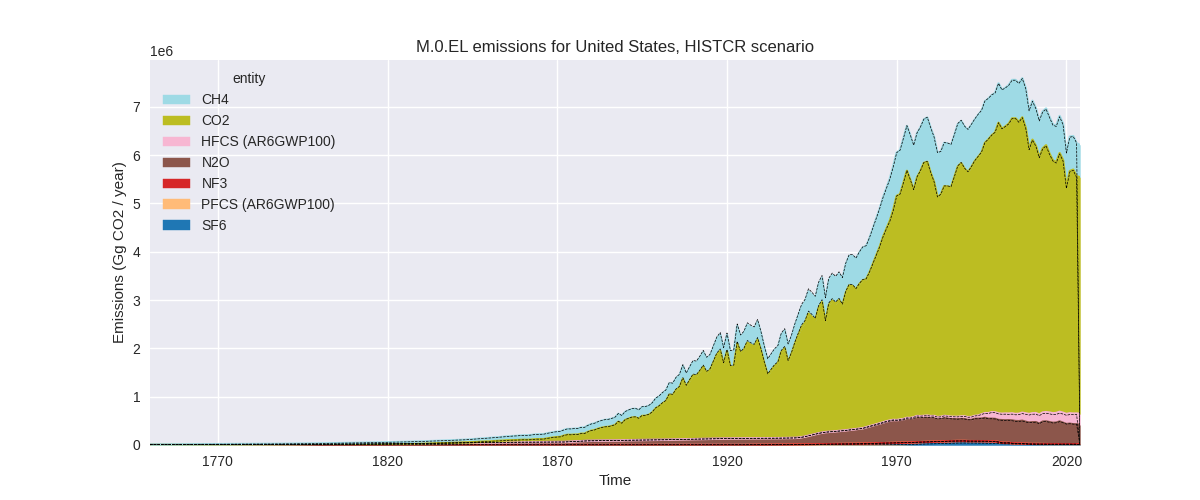
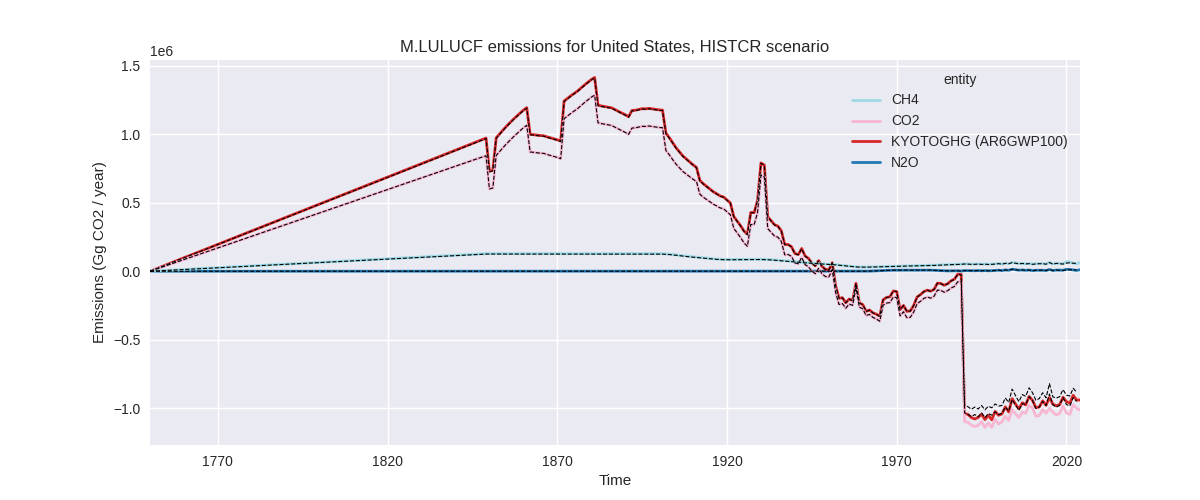
The following figures show the aggregate national total emissions excluding LULUCF AR6GWP100 for the country reported priority scenario. The dotted linesshow the v2.6.1_final data.
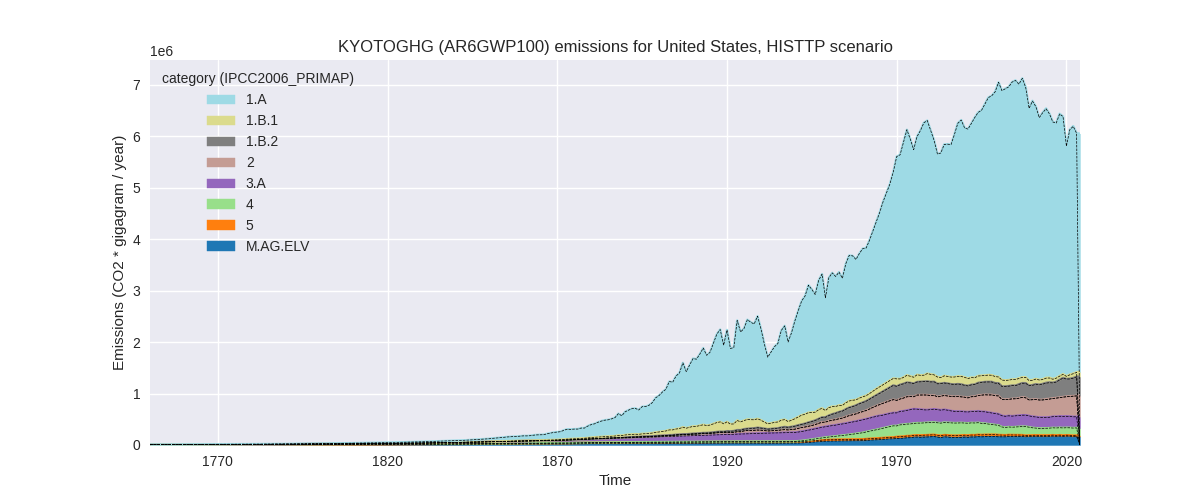
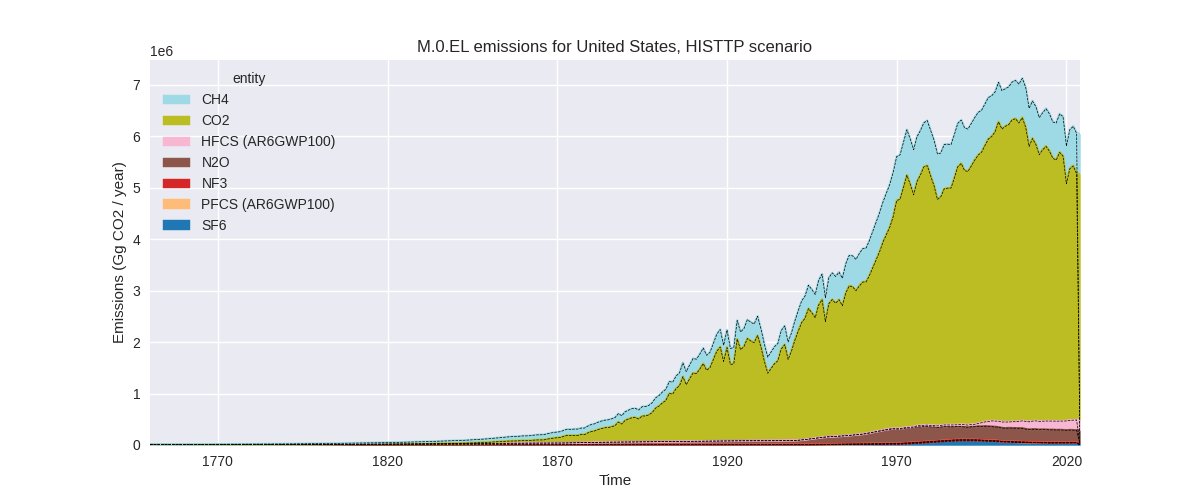
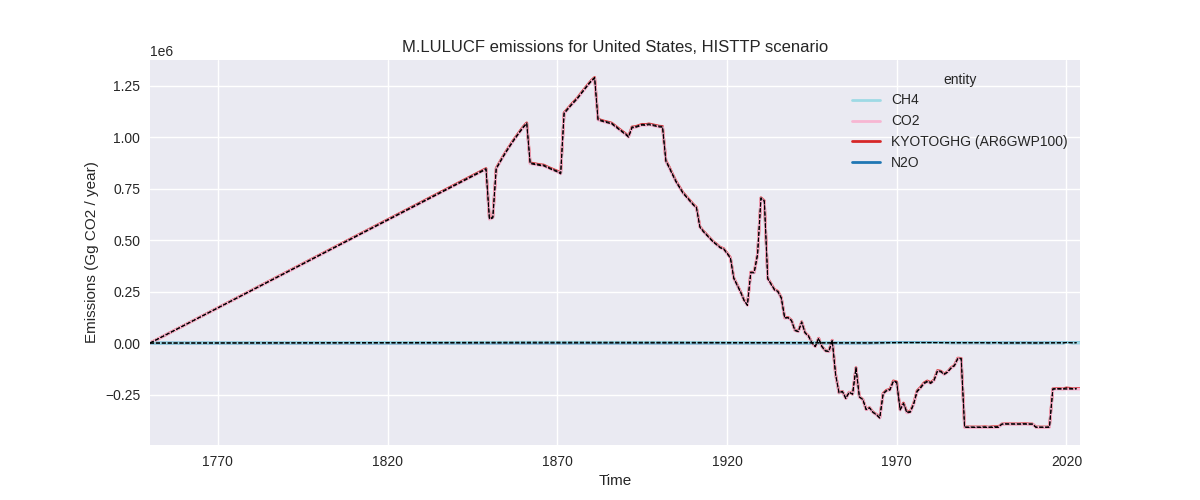
The following figures show the aggregate national total emissions excluding LULUCF AR6GWP100 for the third party priority scenario. The dotted linesshow the v2.6.1_final data.
Overview over changes
In the country reported priority scenario we have the following changes for aggregate Kyoto GHG and national total emissions excluding LULUCF (M.0.EL):
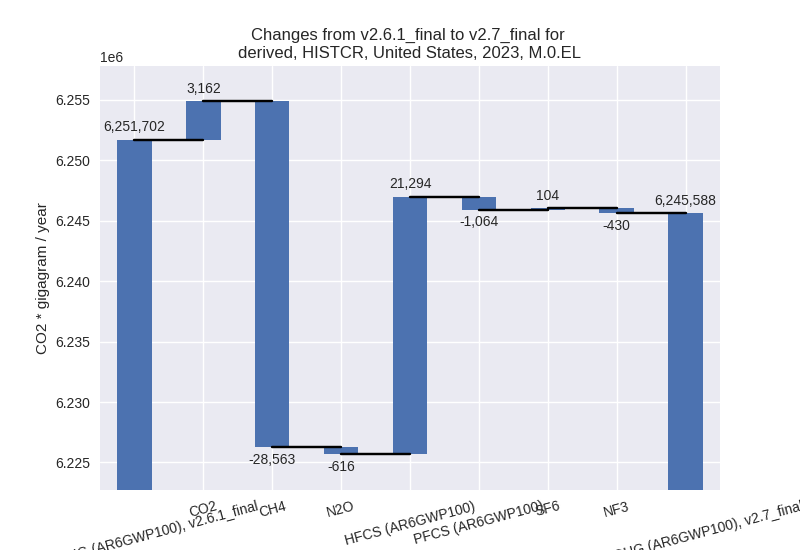
- Emissions in 2023 have changed by -0.1%% (-6113.90 Gg CO2 / year)
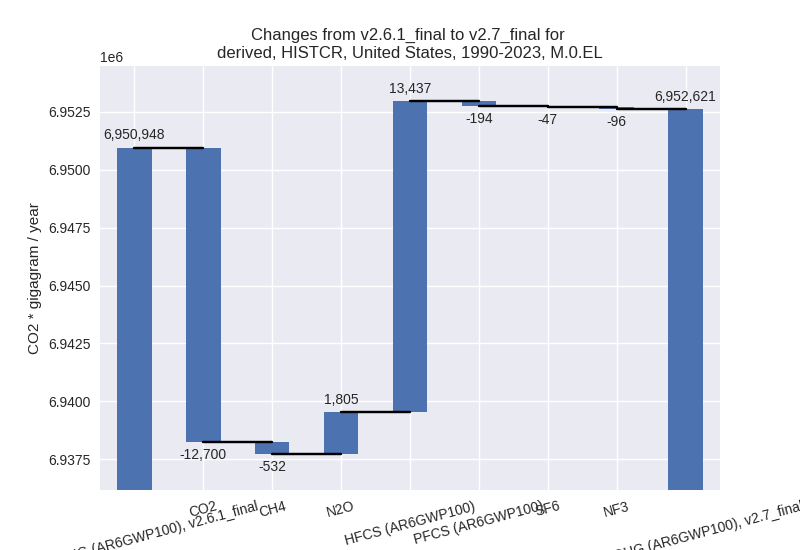
- Emissions in 1990-2023 have changed by 0.0%% (1672.46 Gg CO2 / year)
In the third party priority scenario we have the following changes for aggregate Kyoto GHG and national total emissions excluding LULUCF (M.0.EL):
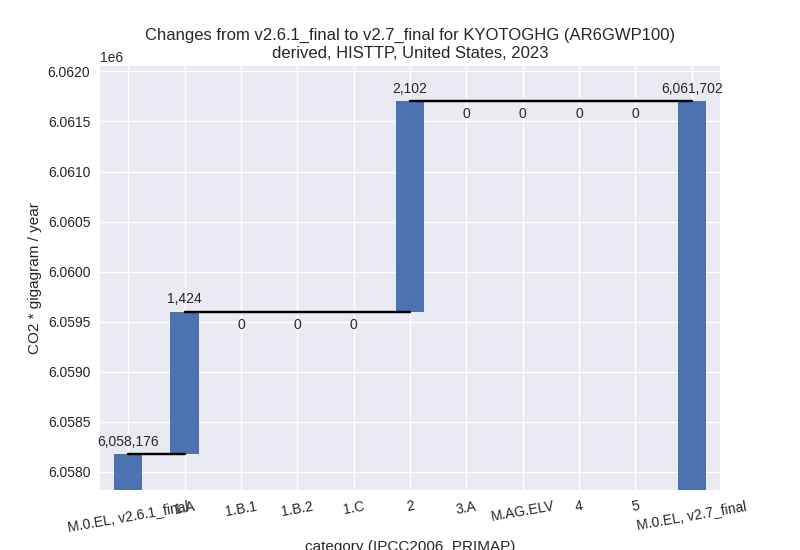
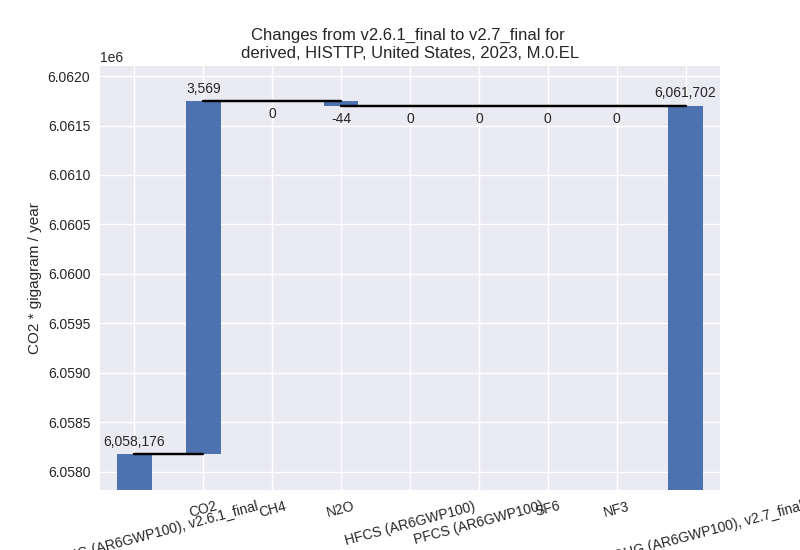
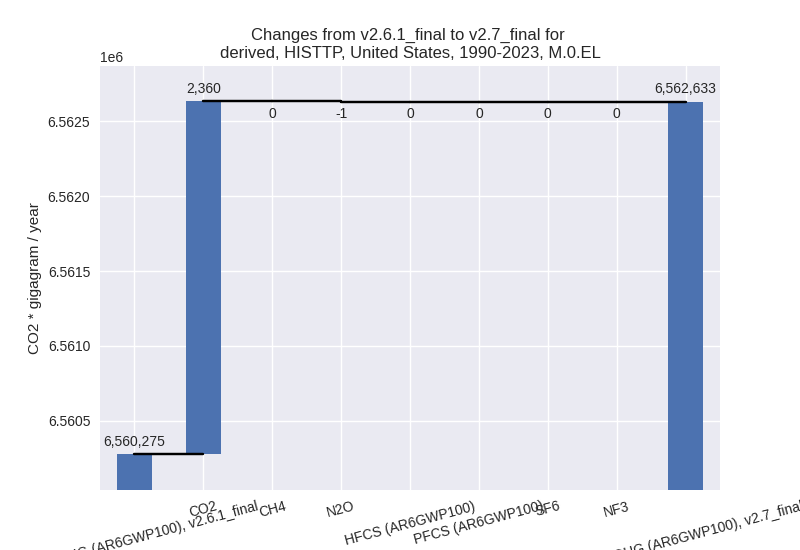
- Emissions in 2023 have changed by 0.1%% (3525.40 Gg CO2 / year)
- Emissions in 1990-2023 have changed by 0.0%% (2358.14 Gg CO2 / year)
Most important changes per scenario and time frame
In the country reported priority scenario the following sector-gas combinations have the highest absolute impact on national total KyotoGHG (AR6GWP100) emissions in 2023 (top 5):
- 1: 2, CO2 with 105853.56 Gg CO2 / year (63.5%)
- 2: 1.A, CO2 with -96138.80 Gg CO2 / year (-2.1%)
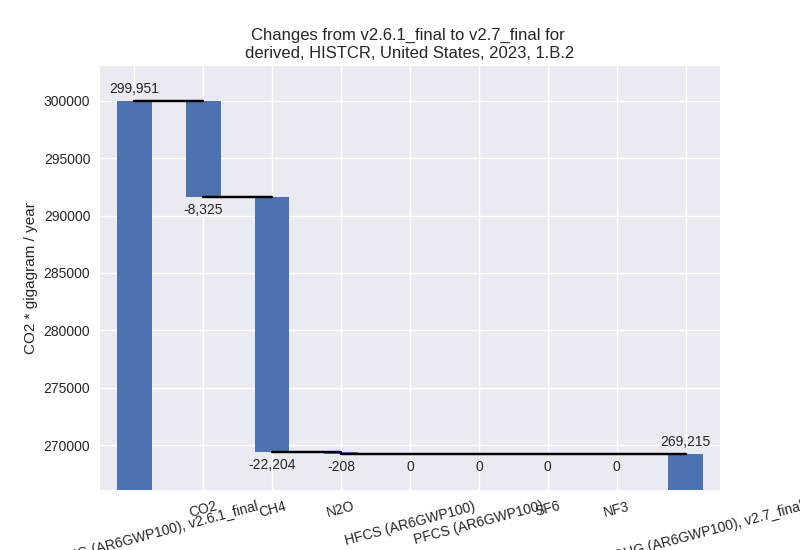
- 3: 1.B.2, CH4 with -22203.61 Gg CO2 / year (-9.6%)
- 4: 2, HFCS (AR6GWP100) with 21294.22 Gg CO2 / year (10.5%)
- 5: 1.B.2, CO2 with -8324.82 Gg CO2 / year (-12.0%)
In the country reported priority scenario the following sector-gas combinations have the highest absolute impact on national total KyotoGHG (AR6GWP100) emissions in 1990-2023 (top 5):
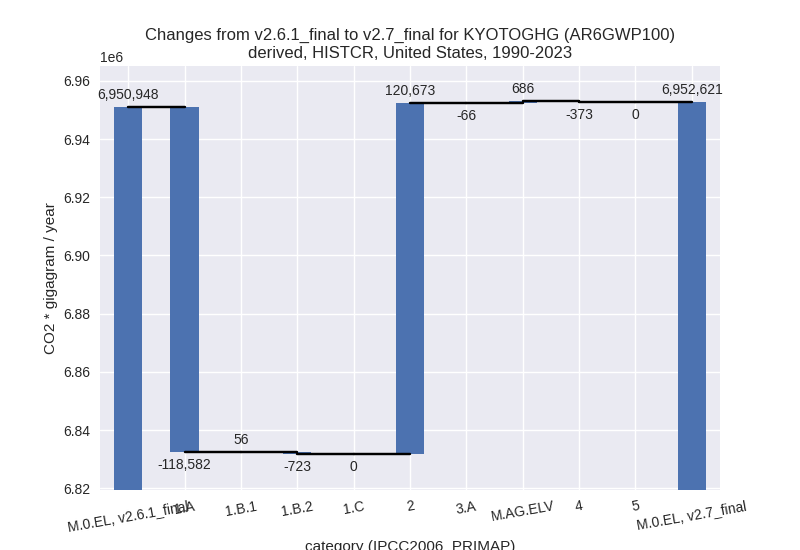
- 1: 1.A, CO2 with -120124.72 Gg CO2 / year (-2.3%)
- 2: 2, CO2 with 107612.94 Gg CO2 / year (56.5%)
- 3: 2, HFCS (AR6GWP100) with 13436.88 Gg CO2 / year (9.7%)
- 4: 1.A, N2O with 1212.95 Gg CO2 / year (2.0%)
- 5: M.AG.ELV, N2O with 844.15 Gg CO2 / year (0.3%)
In the third party priority scenario the following sector-gas combinations have the highest absolute impact on national total KyotoGHG (AR6GWP100) emissions in 2023 (top 5):
- 1: 2, CO2 with 2145.34 Gg CO2 / year (1.6%)
- 2: 1.A, CO2 with 1423.50 Gg CO2 / year (0.0%)
- 3: 2, N2O with -43.53 Gg CO2 / year (-0.2%)
- 4: 1.A, CH4 with 0.00 Gg CO2 / year (0.0%)
- 5: M.AG.ELV, CO2 with 0.00 Gg CO2 / year (0.0%)
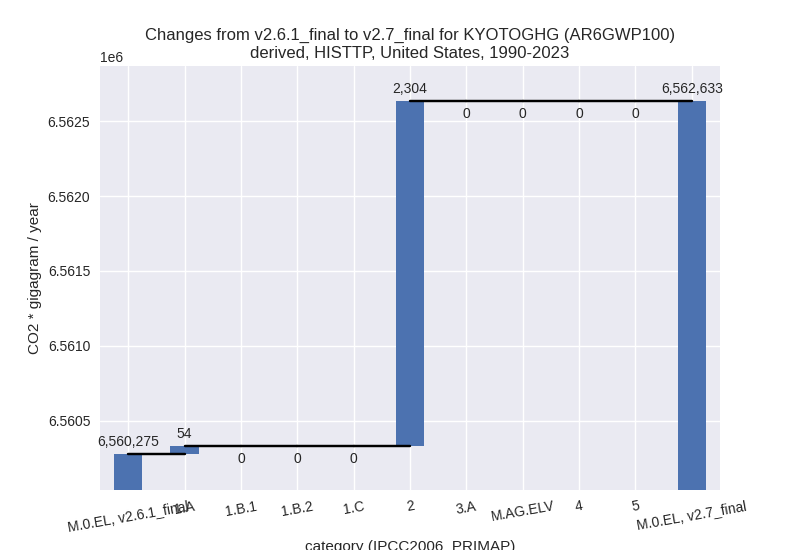
In the third party priority scenario the following sector-gas combinations have the highest absolute impact on national total KyotoGHG (AR6GWP100) emissions in 1990-2023 (top 5):
- 1: 2, CO2 with 2305.84 Gg CO2 / year (1.9%)
- 2: 1.A, CO2 with 53.75 Gg CO2 / year (0.0%)
- 3: 2, N2O with -1.45 Gg CO2 / year (-0.0%)
- 4: 1.A, CH4 with 0.00 Gg CO2 / year (0.0%)
- 5: M.AG.ELV, CO2 with 0.00 Gg CO2 / year (0.0%)
Notes on data changes
Here we list notes explaining important emissions changes for the country.
- Data from BTR1 has been replaced by data from the 2025 draft
inventory. This leads to changes in several sectors and gases which are
small in terms of total emissions.
- The most prominent change in the CR time-series is that we have high CO2 emissions in 2.D while emissions in 1.A are lower. This is due to a difference in accounting of no-fuel use of fossil fuels between the national inventory and the UNFCCC submitted inventory.
- CO2 in 2.H is now non-zero. This also affects the TP time-series as there is no third party data for 2.H.
- CH4 in 1.B.2 is lower because the CR data shows a continuation of the downward trend while EDGAR data used for extrapolation in v2.6.1 shows an emission increase. For CO2 there is a similar effect.
- HFCs are higher for all years after 1990.
- N2O and CH4 for 1.A also differ from older country reported data.
- Changes in the TP time series are small. The main impacts come from the new EI data for energy CO2 and the inclusion of CO2 emissions in 2.H in the new country reported data.
Changes by sector and gas
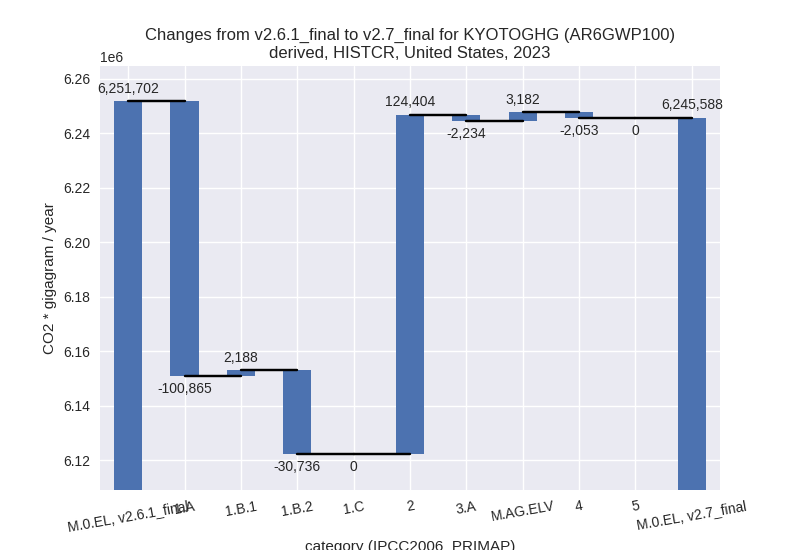
For each scenario and time frame the changes are displayed for all individual sectors and all individual gases. In the sector plot we use aggregate Kyoto GHGs in AR6GWP100. In the gas plot we usenational total emissions without LULUCF.
country reported scenario
2023
1990-2023
third party scenario
2023
1990-2023
Detailed changes for the scenarios:
country reported scenario (HISTCR):
Most important changes per time frame
For 2023 the following sector-gas combinations have the highest absolute impact on national total KyotoGHG (AR6GWP100) emissions in 2023 (top 5):
- 1: 2, CO2 with 105853.56 Gg CO2 / year (63.5%)
- 2: 1.A, CO2 with -96138.80 Gg CO2 / year (-2.1%)
- 3: 1.B.2, CH4 with -22203.61 Gg CO2 / year (-9.6%)
- 4: 2, HFCS (AR6GWP100) with 21294.22 Gg CO2 / year (10.5%)
- 5: 1.B.2, CO2 with -8324.82 Gg CO2 / year (-12.0%)
For 1990-2023 the following sector-gas combinations have the highest absolute impact on national total KyotoGHG (AR6GWP100) emissions in 1990-2023 (top 5):
- 1: 1.A, CO2 with -120124.72 Gg CO2 / year (-2.3%)
- 2: 2, CO2 with 107612.94 Gg CO2 / year (56.5%)
- 3: 2, HFCS (AR6GWP100) with 13436.88 Gg CO2 / year (9.7%)
- 4: 1.A, N2O with 1212.95 Gg CO2 / year (2.0%)
- 5: M.AG.ELV, N2O with 844.15 Gg CO2 / year (0.3%)
Changes in the main sectors for aggregate KyotoGHG (AR6GWP100) are
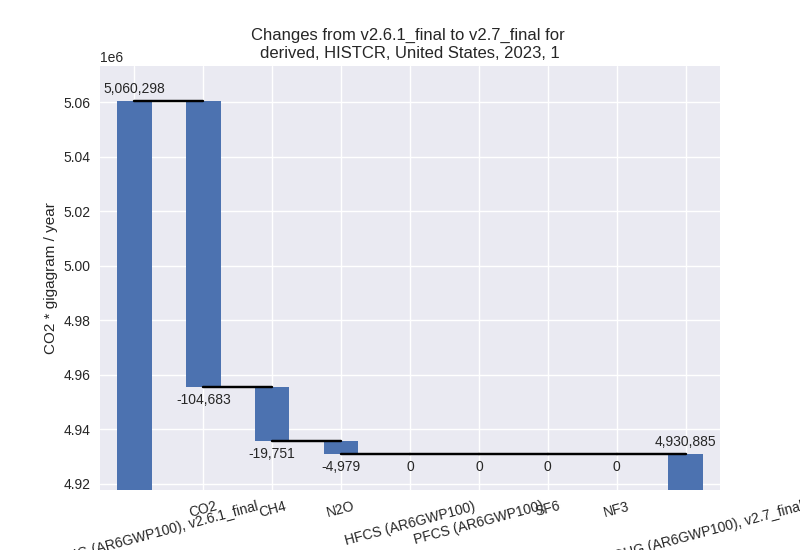
- 1: Total sectoral emissions in 2022 are 5082147.30
Gg CO2 / year which is 79.5% of M.0.EL emissions. 2023 Emissions have
changed by -2.6% (-129412.90 Gg CO2
/ year). 1990-2023 Emissions have changed by -2.1% (-119248.50 Gg CO2 / year). For 2023
the changes per gas
are:
For 1990-2023 the changes per gas are: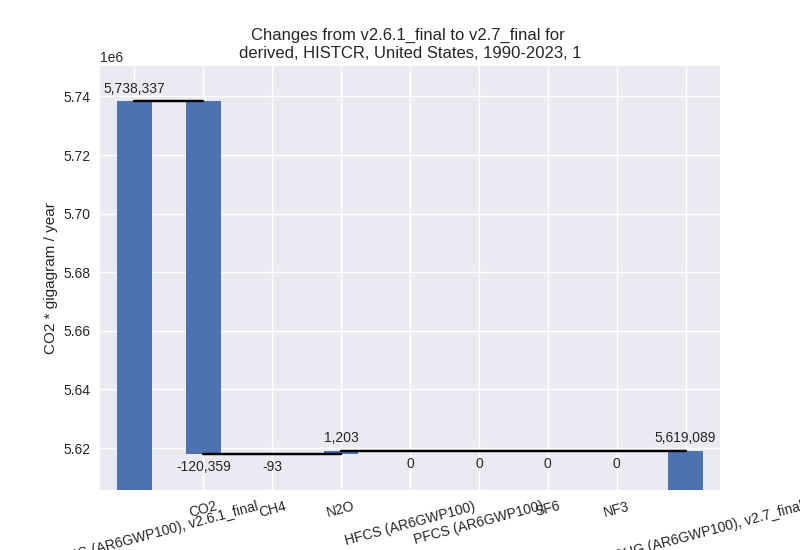
The changes come from the following subsectors:- 1.A: Total sectoral emissions in 2022 are
4754722.10 Gg CO2 / year which is 93.6% of category 1 emissions. 2023
Emissions have changed by -2.1%
(-100865.10 Gg CO2 / year). 1990-2023 Emissions have changed by -2.2% (-118581.74 Gg CO2 / year). For 2023
the changes per gas
are:
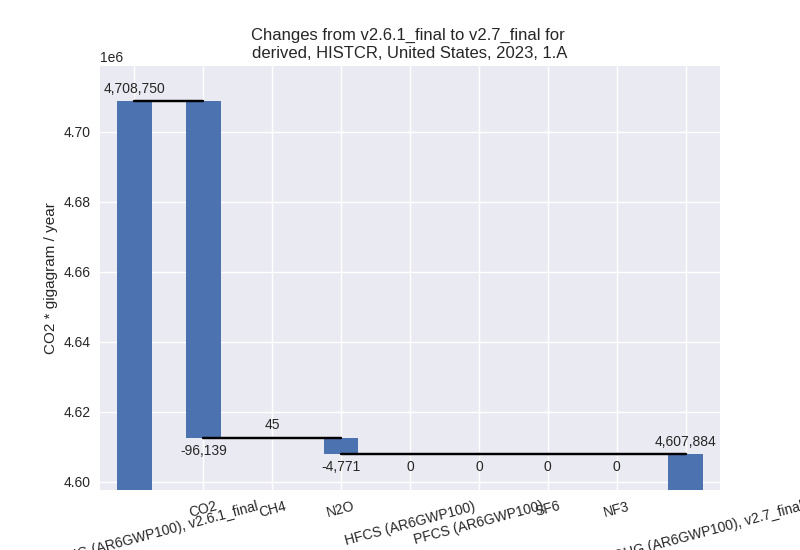
For 1990-2023 the changes per gas are: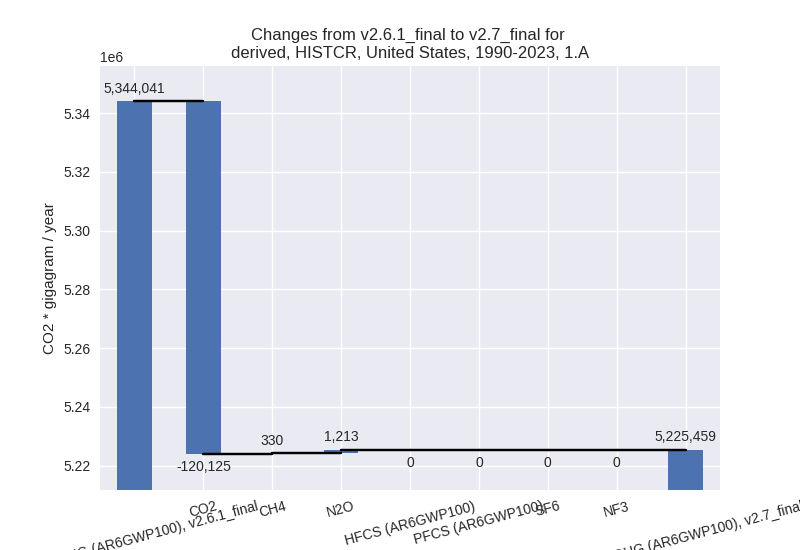
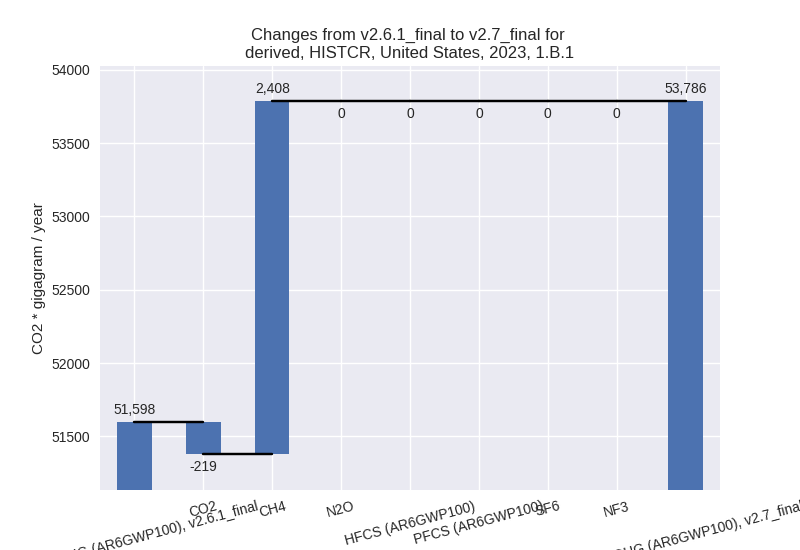
There is no subsector information available in PRIMAP-hist. - 1.B.1: Total sectoral emissions in 2022 are
52028.42 Gg CO2 / year which is 1.0% of category 1 emissions. 2023
Emissions have changed by 4.2%
(2188.20 Gg CO2 / year). 1990-2023 Emissions have changed by 0.1% (56.49 Gg CO2 / year). For 2023 the
changes per gas
are:
There is no subsector information available in PRIMAP-hist. - 1.B.2: Total sectoral emissions in 2022 are
275396.76 Gg CO2 / year which is 5.4% of category 1 emissions. 2023
Emissions have changed by -10.2%
(-30736.04 Gg CO2 / year). 1990-2023 Emissions have changed by -0.2% (-723.26 Gg CO2 / year). For 2023
the changes per gas
are:
There is no subsector information available in PRIMAP-hist.
- 1.A: Total sectoral emissions in 2022 are
4754722.10 Gg CO2 / year which is 93.6% of category 1 emissions. 2023
Emissions have changed by -2.1%
(-100865.10 Gg CO2 / year). 1990-2023 Emissions have changed by -2.2% (-118581.74 Gg CO2 / year). For 2023
the changes per gas
are:
- 2: Total sectoral emissions in 2022 are 525083.37
Gg CO2 / year which is 8.2% of M.0.EL emissions. 2023 Emissions have
changed by 30.9% (124403.81 Gg CO2 /
year). 1990-2023 Emissions have changed by 30.6% (120673.00 Gg CO2 / year). For 2023
the changes per gas
are:
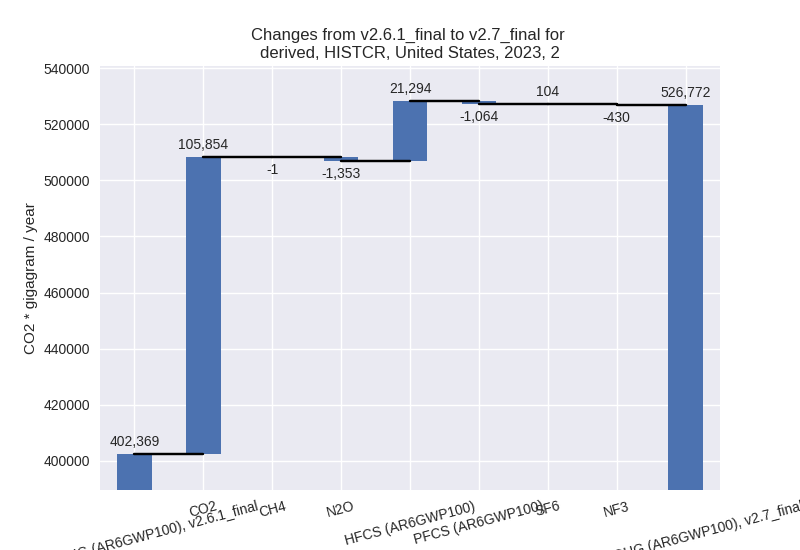
For 1990-2023 the changes per gas are: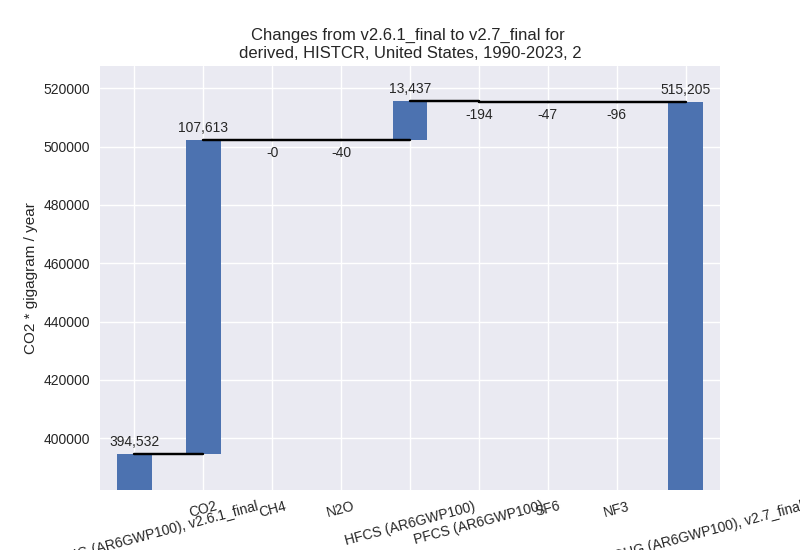
- M.AG: Total sectoral emissions in 2022 are 601598.29 Gg CO2 / year which is 9.4% of M.0.EL emissions. 2023 Emissions have changed by 0.2% (948.04 Gg CO2 / year). 1990-2023 Emissions have changed by 0.1% (620.54 Gg CO2 / year).
- 4: Total sectoral emissions in 2022 are 165288.73 Gg CO2 / year which is 2.6% of M.0.EL emissions. 2023 Emissions have changed by -1.2% (-2052.84 Gg CO2 / year). 1990-2023 Emissions have changed by -0.2% (-372.58 Gg CO2 / year).
- 5: Total sectoral emissions in 2022 are 18206.16 Gg CO2 / year which is 0.3% of M.0.EL emissions. 2023 Emissions have changed by 0.0% (0.00 Gg CO2 / year). 1990-2023 Emissions have changed by 0.0% (0.00 Gg CO2 / year).
third party scenario (HISTTP):
Most important changes per time frame
For 2023 the following sector-gas combinations have the highest absolute impact on national total KyotoGHG (AR6GWP100) emissions in 2023 (top 5):
- 1: 2, CO2 with 2145.34 Gg CO2 / year (1.6%)
- 2: 1.A, CO2 with 1423.50 Gg CO2 / year (0.0%)
- 3: 2, N2O with -43.53 Gg CO2 / year (-0.2%)
- 4: 1.A, CH4 with 0.00 Gg CO2 / year (0.0%)
- 5: M.AG.ELV, CO2 with 0.00 Gg CO2 / year (0.0%)
For 1990-2023 the following sector-gas combinations have the highest absolute impact on national total KyotoGHG (AR6GWP100) emissions in 1990-2023 (top 5):
- 1: 2, CO2 with 2305.84 Gg CO2 / year (1.9%)
- 2: 1.A, CO2 with 53.75 Gg CO2 / year (0.0%)
- 3: 2, N2O with -1.45 Gg CO2 / year (-0.0%)
- 4: 1.A, CH4 with 0.00 Gg CO2 / year (0.0%)
- 5: M.AG.ELV, CO2 with 0.00 Gg CO2 / year (0.0%)
Changes in the main sectors for aggregate KyotoGHG (AR6GWP100) are
- 1: Total sectoral emissions in 2022 are 5244977.00 Gg CO2 / year which is 84.7% of M.0.EL emissions. 2023 Emissions have changed by 0.0% (1423.50 Gg CO2 / year). 1990-2023 Emissions have changed by 0.0% (53.75 Gg CO2 / year).
- 2: Total sectoral emissions in 2022 are 403521.40 Gg CO2 / year which is 6.5% of M.0.EL emissions. 2023 Emissions have changed by 0.5% (2101.81 Gg CO2 / year). 1990-2023 Emissions have changed by 0.7% (2304.40 Gg CO2 / year).
- M.AG: Total sectoral emissions in 2022 are 382318.82 Gg CO2 / year which is 6.2% of M.0.EL emissions. 2023 Emissions have changed by 0.0% (0.00 Gg CO2 / year). 1990-2023 Emissions have changed by 0.0% (0.00 Gg CO2 / year).
- 4: Total sectoral emissions in 2022 are 146898.44 Gg CO2 / year which is 2.4% of M.0.EL emissions. 2023 Emissions have changed by 0.0% (0.00 Gg CO2 / year). 1990-2023 Emissions have changed by 0.0% (0.00 Gg CO2 / year).
- 5: Total sectoral emissions in 2022 are 18206.16 Gg CO2 / year which is 0.3% of M.0.EL emissions. 2023 Emissions have changed by 0.0% (0.00 Gg CO2 / year). 1990-2023 Emissions have changed by 0.0% (0.00 Gg CO2 / year).