Changes in PRIMAP-hist v2.7_final compared to v2.6.1_final for South Africa
2025-09-11
Johannes Gütschow
Change analysis for South Africa for PRIMAP-hist v2.7_final compared to v2.6.1_final
Overview over emissions by sector and gas
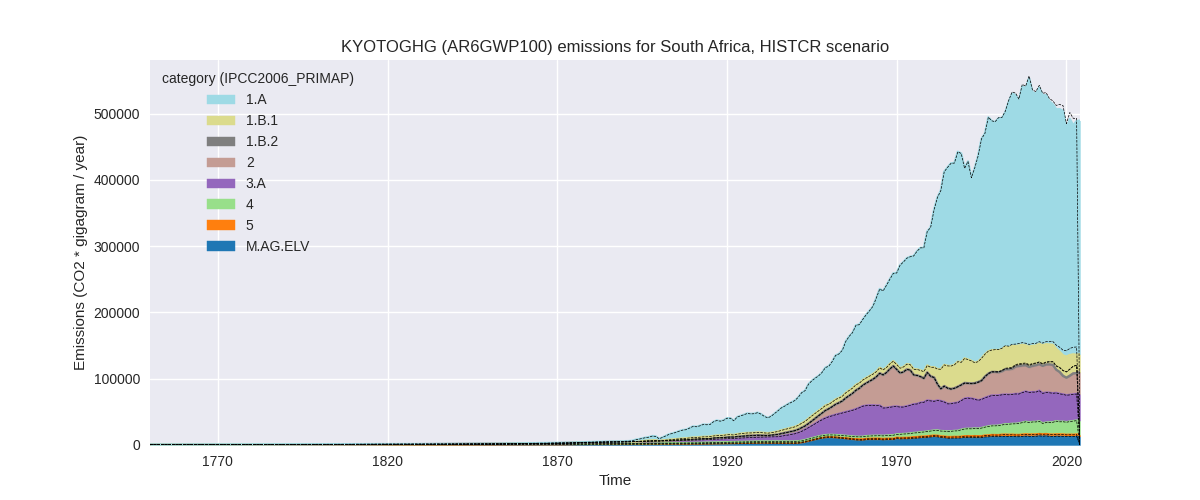
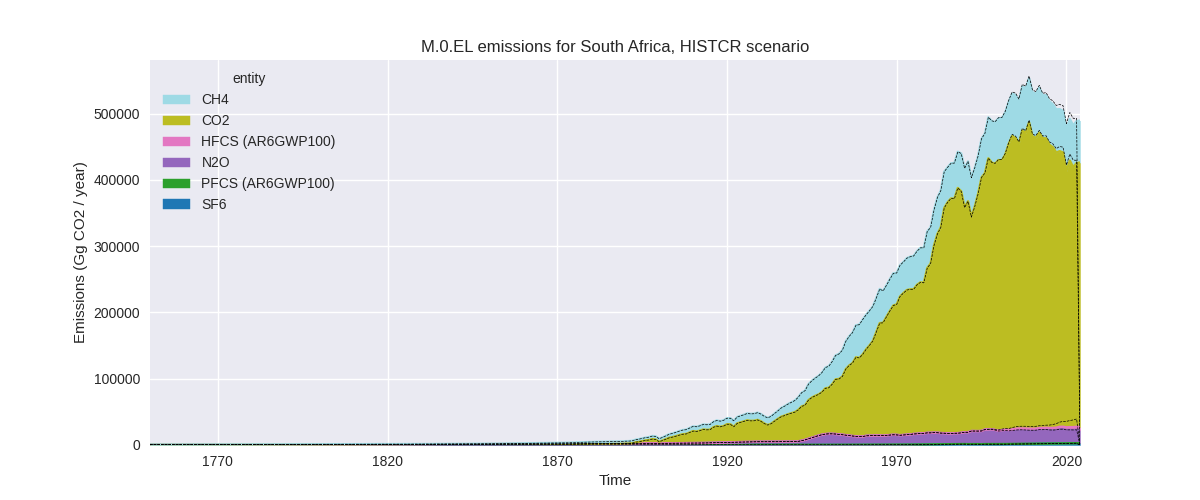
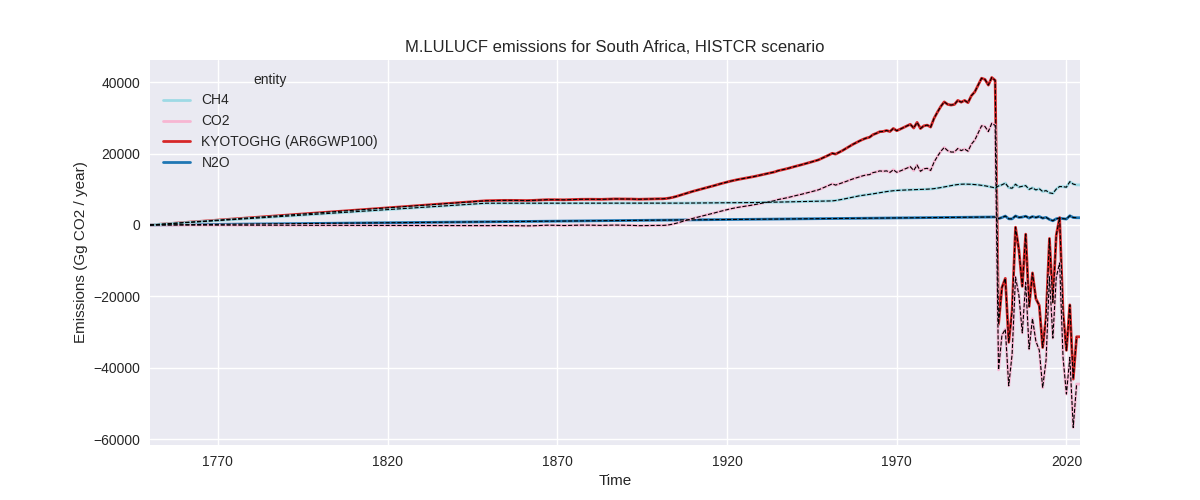
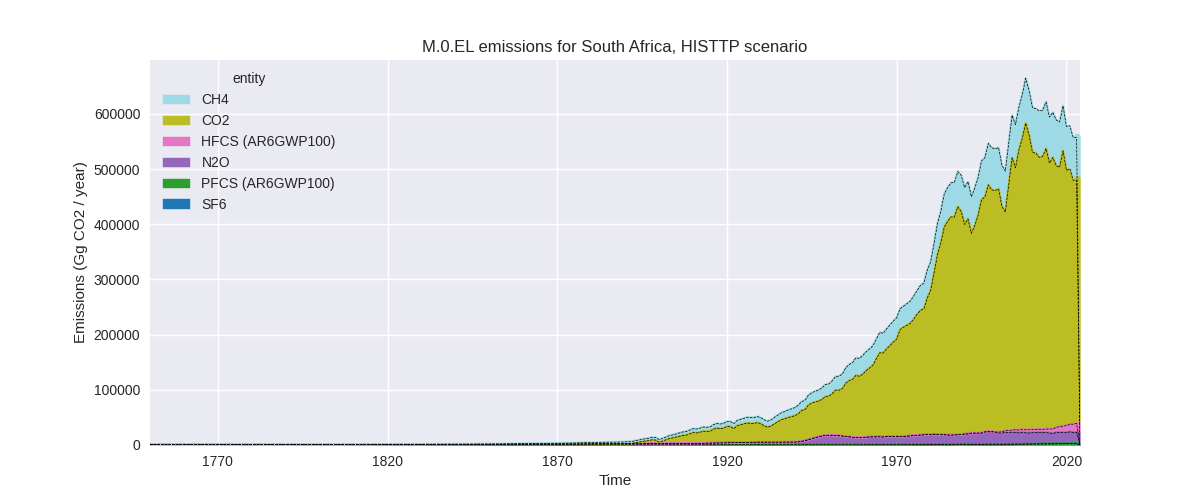
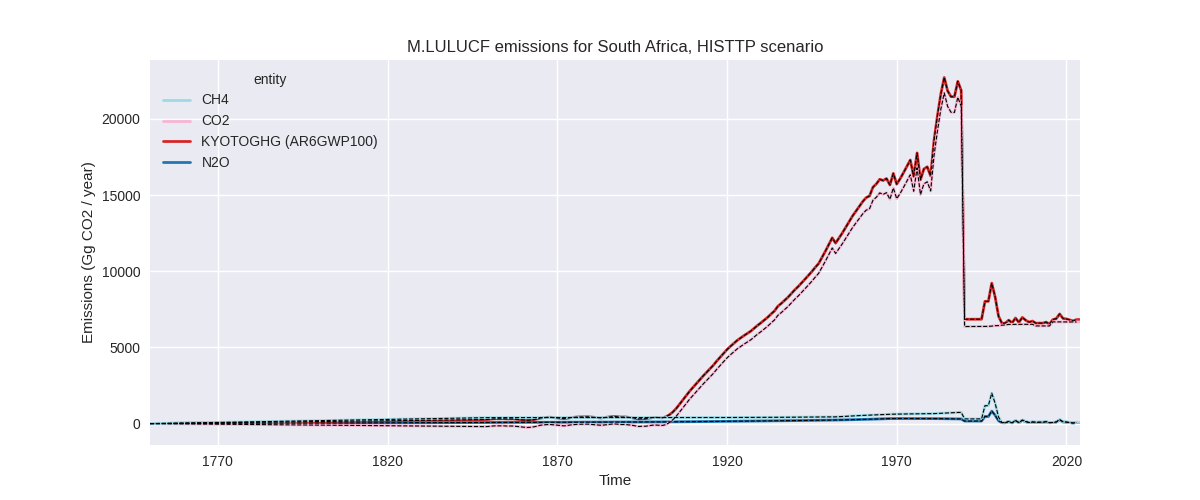
The following figures show the aggregate national total emissions excluding LULUCF AR6GWP100 for the country reported priority scenario. The dotted linesshow the v2.6.1_final data.
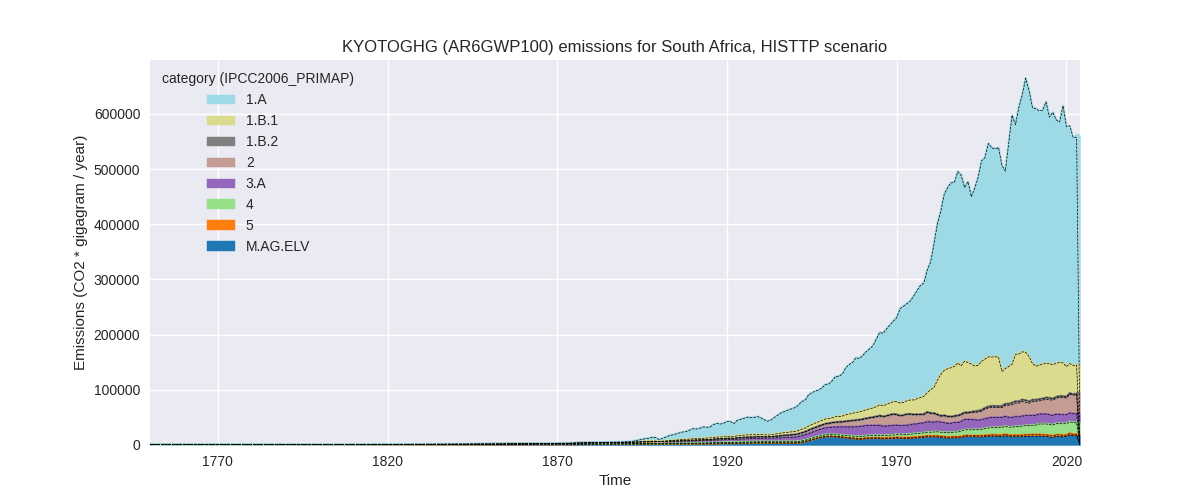
The following figures show the aggregate national total emissions excluding LULUCF AR6GWP100 for the third party priority scenario. The dotted linesshow the v2.6.1_final data.
Overview over changes
In the country reported priority scenario we have the following changes for aggregate Kyoto GHG and national total emissions excluding LULUCF (M.0.EL):
- Emissions in 2023 have changed by -0.8%% (-3949.21 Gg CO2 / year)
- Emissions in 1990-2023 have changed by -0.6%% (-3223.09 Gg CO2 / year)
In the third party priority scenario we have the following changes for aggregate Kyoto GHG and national total emissions excluding LULUCF (M.0.EL):
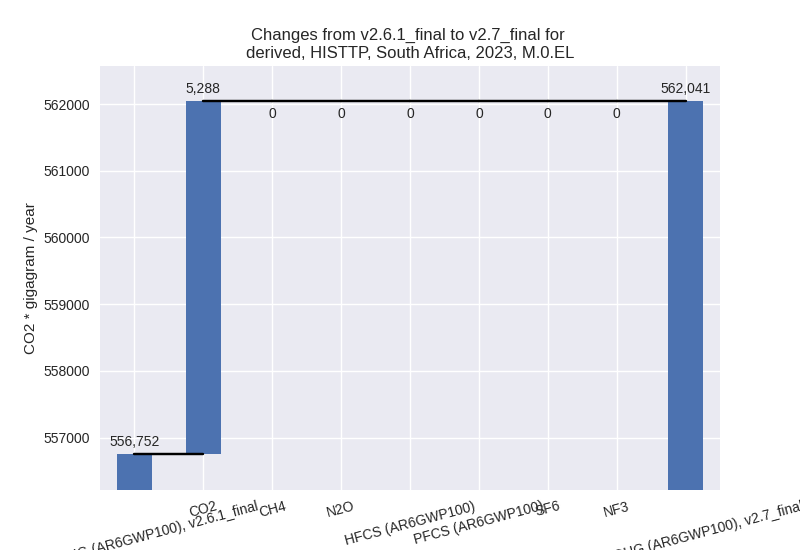
- Emissions in 2023 have changed by 0.9%% (5288.40 Gg CO2 / year)
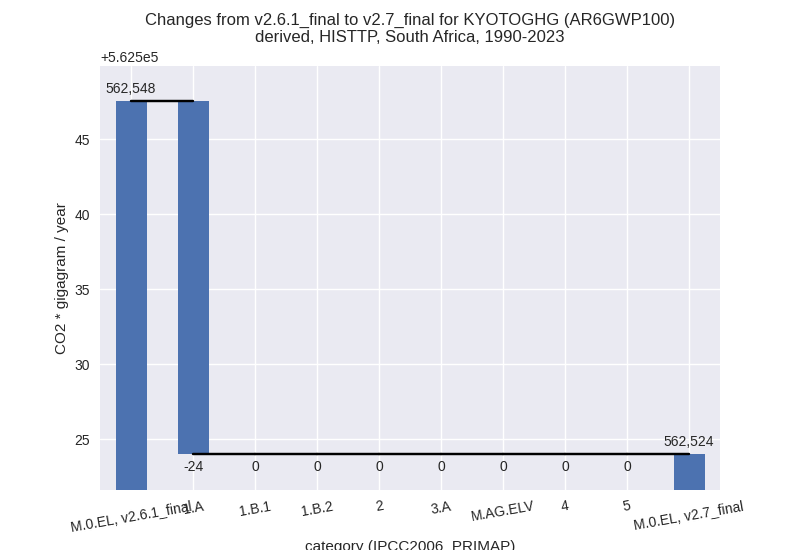
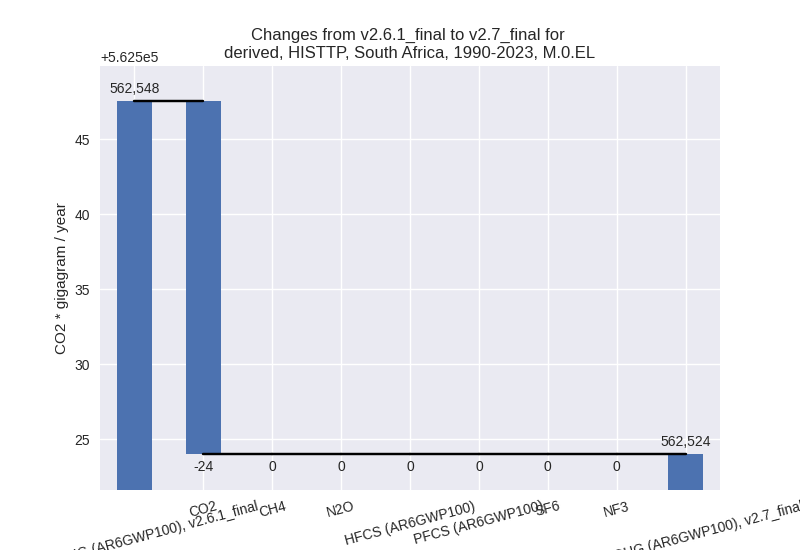
- Emissions in 1990-2023 have changed by -0.0%% (-23.51 Gg CO2 / year)
Most important changes per scenario and time frame
In the country reported priority scenario the following sector-gas combinations have the highest absolute impact on national total KyotoGHG (AR6GWP100) emissions in 2023 (top 5):
- 1: 2, HFCS (AR6GWP100) with -11739.37 Gg CO2 / year (-71.9%)
- 2: 1.A, CO2 with 7790.15 Gg CO2 / year (2.3%)
- 3: 1.A, CH4 with 0.00 Gg CO2 / year (0.0%)
- 4: 2, PFCS (AR6GWP100) with 0.00 Gg CO2 / year (0.0%)
- 5: M.AG.ELV, N2O with 0.00 Gg CO2 / year (0.0%)
In the country reported priority scenario the following sector-gas combinations have the highest absolute impact on national total KyotoGHG (AR6GWP100) emissions in 1990-2023 (top 5):
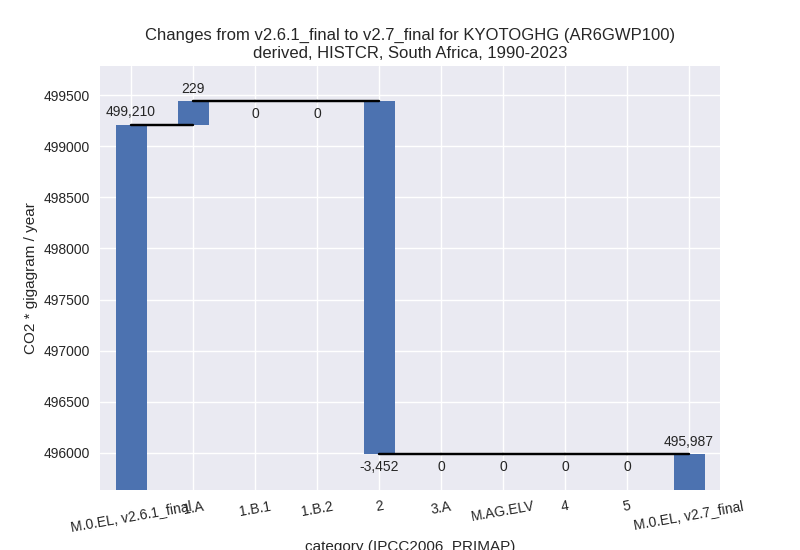
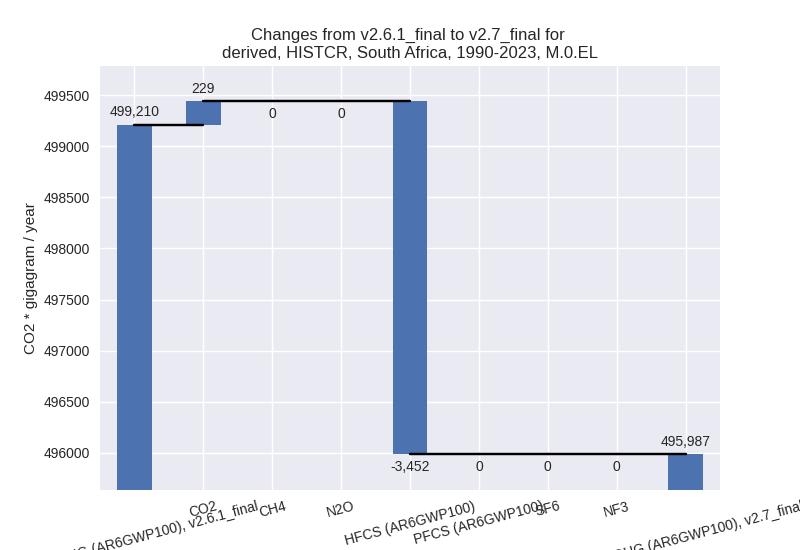
- 1: 2, HFCS (AR6GWP100) with -3452.21 Gg CO2 / year (-65.0%)
- 2: 1.A, CO2 with 229.12 Gg CO2 / year (0.1%)
- 3: 1.A, CH4 with 0.00 Gg CO2 / year (0.0%)
- 4: 2, PFCS (AR6GWP100) with 0.00 Gg CO2 / year (0.0%)
- 5: M.AG.ELV, N2O with 0.00 Gg CO2 / year (0.0%)
In the third party priority scenario the following sector-gas combinations have the highest absolute impact on national total KyotoGHG (AR6GWP100) emissions in 2023 (top 5):
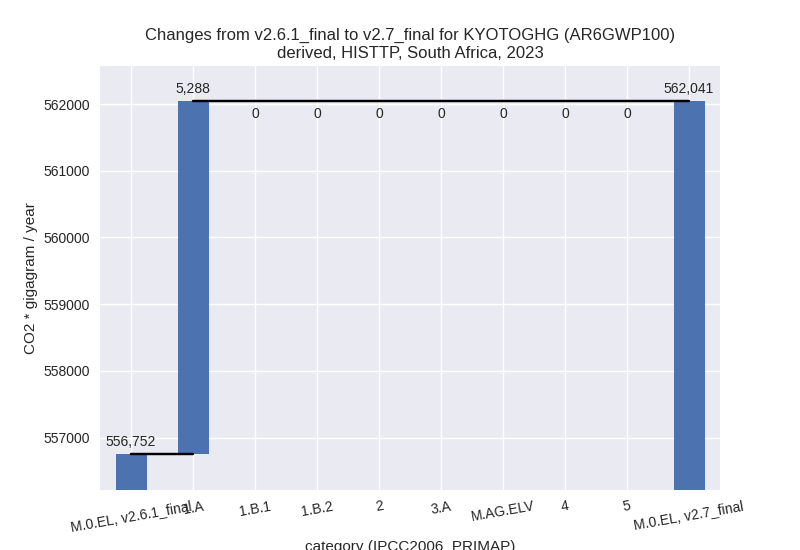
- 1: 1.A, CO2 with 5288.40 Gg CO2 / year (1.3%)
- 2: 1.A, CH4 with 0.00 Gg CO2 / year (0.0%)
- 3: 2, HFCS (AR6GWP100) with 0.00 Gg CO2 / year (0.0%)
- 4: 2, PFCS (AR6GWP100) with 0.00 Gg CO2 / year (0.0%)
- 5: M.AG.ELV, N2O with 0.00 Gg CO2 / year (0.0%)
In the third party priority scenario the following sector-gas combinations have the highest absolute impact on national total KyotoGHG (AR6GWP100) emissions in 1990-2023 (top 5):
- 1: 1.A, CO2 with -23.51 Gg CO2 / year (-0.0%)
- 2: 1.A, CH4 with 0.00 Gg CO2 / year (0.0%)
- 3: 2, HFCS (AR6GWP100) with 0.00 Gg CO2 / year (0.0%)
- 4: 2, PFCS (AR6GWP100) with 0.00 Gg CO2 / year (0.0%)
- 5: M.AG.ELV, N2O with 0.00 Gg CO2 / year (0.0%)
Notes on data changes
Here we list notes explaining important emissions changes for the country.
- South Africa has resubmitted their first CRT data because in the original submission the IPPU sector tables were missing and thus there was no individual HFC information. Due to a processing error the default conversion factors fro HFC basket GWPs were nit applied and only the AR5 GWP time-series used the country reported HFC data. As country reported HFC data is much lower than EDGAR data, HFC time-series in the CR scenario are much lower for SAR, AR4, and AR6 GWPs than in PRIMAP-hist v2.6.1.
- Energy CO2 has slight changes from changes in EI data.
Changes by sector and gas
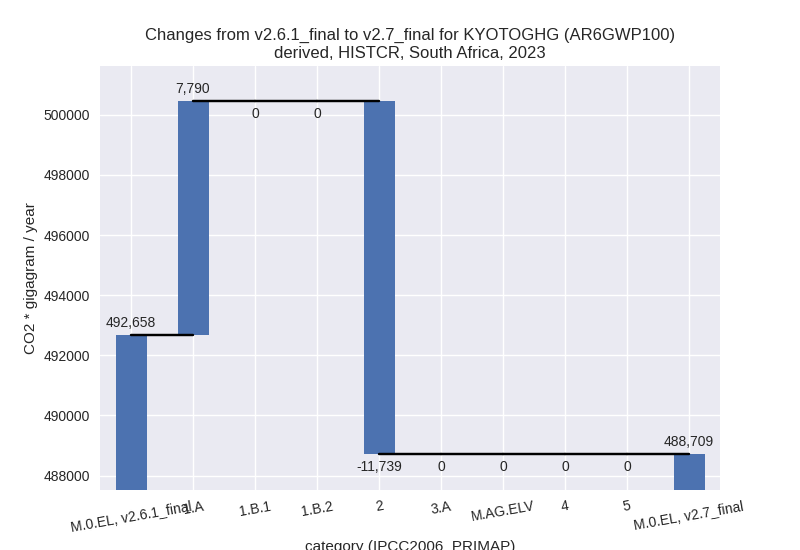
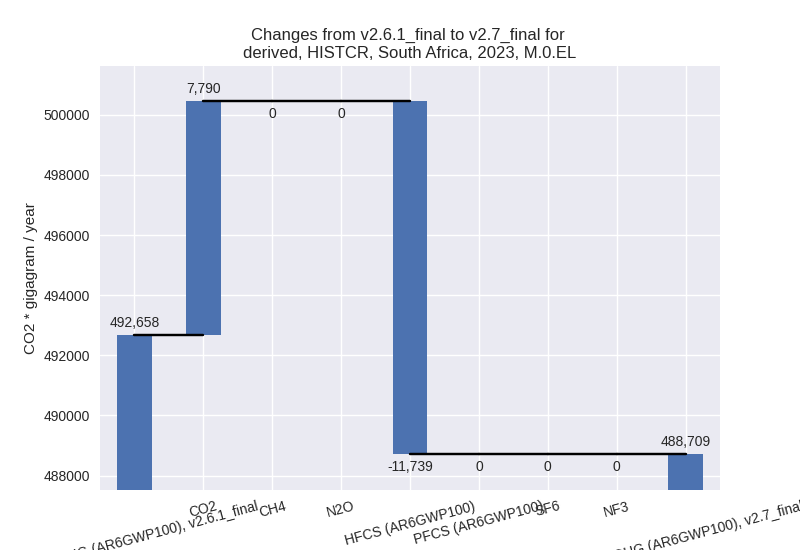
For each scenario and time frame the changes are displayed for all individual sectors and all individual gases. In the sector plot we use aggregate Kyoto GHGs in AR6GWP100. In the gas plot we usenational total emissions without LULUCF.
country reported scenario
2023
1990-2023
third party scenario
2023
1990-2023
Detailed changes for the scenarios:
country reported scenario (HISTCR):
Most important changes per time frame
For 2023 the following sector-gas combinations have the highest absolute impact on national total KyotoGHG (AR6GWP100) emissions in 2023 (top 5):
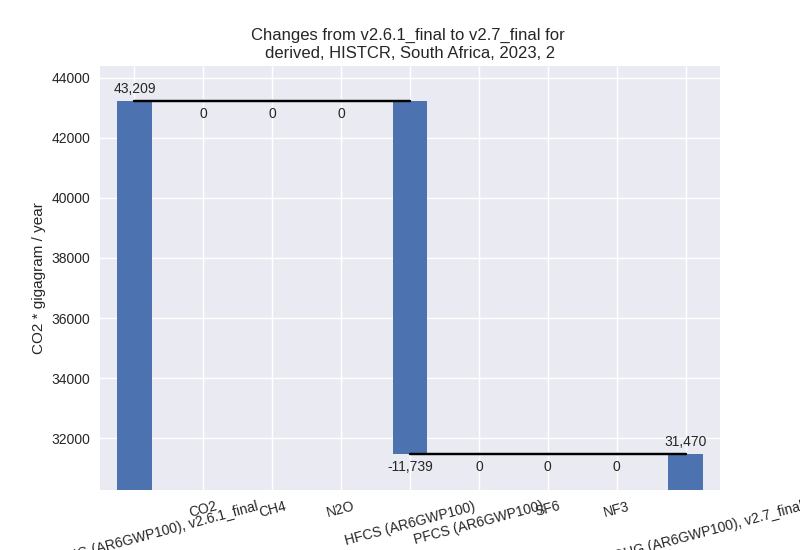
- 1: 2, HFCS (AR6GWP100) with -11739.37 Gg CO2 / year (-71.9%)
- 2: 1.A, CO2 with 7790.15 Gg CO2 / year (2.3%)
- 3: 1.A, CH4 with 0.00 Gg CO2 / year (0.0%)
- 4: 2, PFCS (AR6GWP100) with 0.00 Gg CO2 / year (0.0%)
- 5: M.AG.ELV, N2O with 0.00 Gg CO2 / year (0.0%)
For 1990-2023 the following sector-gas combinations have the highest absolute impact on national total KyotoGHG (AR6GWP100) emissions in 1990-2023 (top 5):
- 1: 2, HFCS (AR6GWP100) with -3452.21 Gg CO2 / year (-65.0%)
- 2: 1.A, CO2 with 229.12 Gg CO2 / year (0.1%)
- 3: 1.A, CH4 with 0.00 Gg CO2 / year (0.0%)
- 4: 2, PFCS (AR6GWP100) with 0.00 Gg CO2 / year (0.0%)
- 5: M.AG.ELV, N2O with 0.00 Gg CO2 / year (0.0%)
Changes in the main sectors for aggregate KyotoGHG (AR6GWP100) are
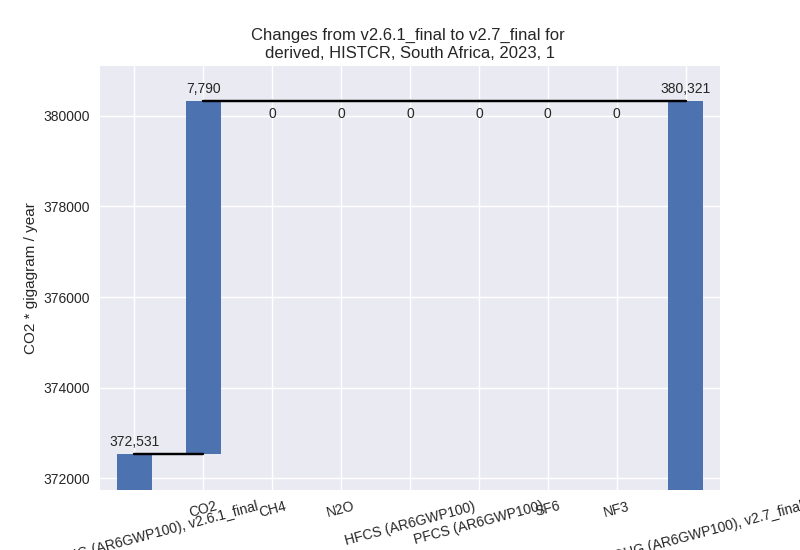
- 1: Total sectoral emissions in 2022 are 374169.23
Gg CO2 / year which is 77.6% of M.0.EL emissions. 2023 Emissions have
changed by 2.1% (7790.15 Gg CO2 /
year). 1990-2023 Emissions have changed by 0.1% (229.12 Gg CO2 / year). For 2023 the
changes per gas
are:
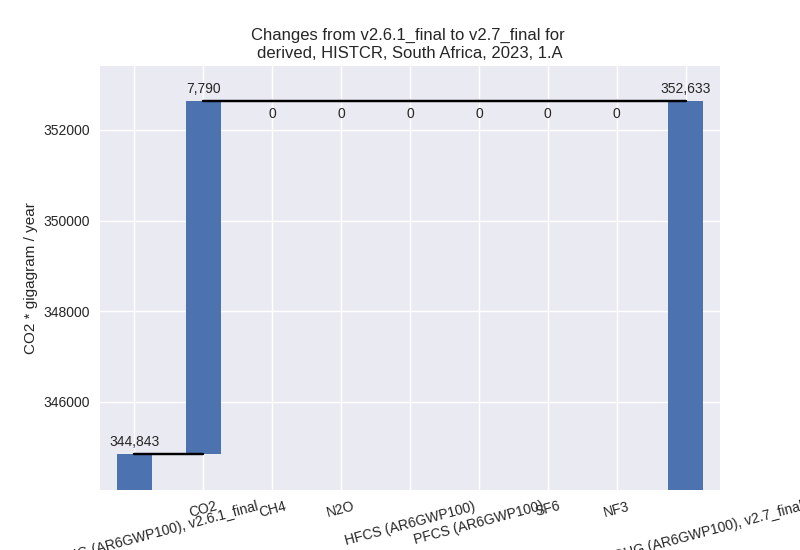
The changes come from the following subsectors:- 1.A: Total sectoral emissions in 2022 are 345387.75
Gg CO2 / year which is 92.3% of category 1 emissions. 2023 Emissions
have changed by 2.3% (7790.15 Gg CO2
/ year). 1990-2023 Emissions have changed by 0.1% (229.12 Gg CO2 / year). For 2023 the
changes per gas
are:
There is no subsector information available in PRIMAP-hist. - 1.B.1: Total sectoral emissions in 2022 are 28686.94 Gg CO2 / year which is 7.7% of category 1 emissions. 2023 Emissions have changed by 0.0% (0.00 Gg CO2 / year). 1990-2023 Emissions have changed by 0.0% (0.00 Gg CO2 / year).
- 1.B.2: Total sectoral emissions in 2022 are 94.54 Gg CO2 / year which is 0.0% of category 1 emissions. 2023 Emissions have changed by 0.0% (0.00 Gg CO2 / year). 1990-2023 Emissions have changed by 0.0% (0.00 Gg CO2 / year).
- 1.A: Total sectoral emissions in 2022 are 345387.75
Gg CO2 / year which is 92.3% of category 1 emissions. 2023 Emissions
have changed by 2.3% (7790.15 Gg CO2
/ year). 1990-2023 Emissions have changed by 0.1% (229.12 Gg CO2 / year). For 2023 the
changes per gas
are:
- 2: Total sectoral emissions in 2022 are 31604.02 Gg
CO2 / year which is 6.6% of M.0.EL emissions. 2023 Emissions have
changed by -27.2% (-11739.37 Gg CO2
/ year). 1990-2023 Emissions have changed by -9.2% (-3452.21 Gg CO2 / year). For 2023
the changes per gas
are:
For 1990-2023 the changes per gas are: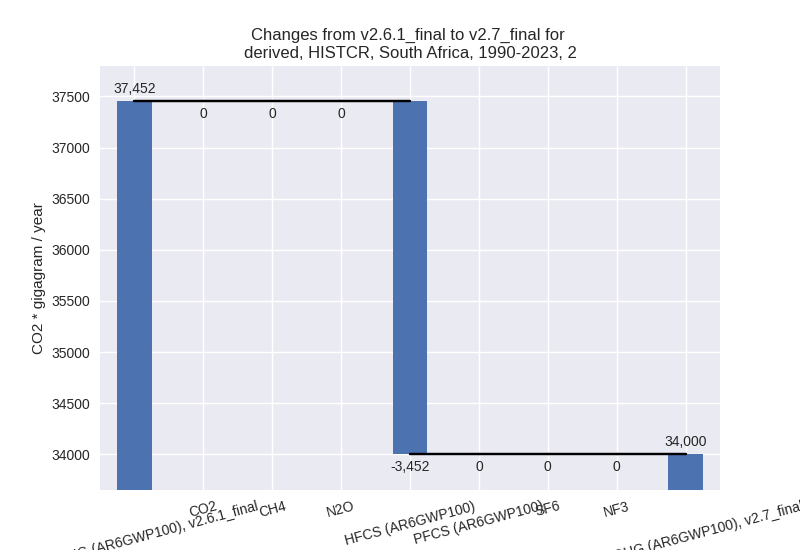
- M.AG: Total sectoral emissions in 2022 are 53124.66 Gg CO2 / year which is 11.0% of M.0.EL emissions. 2023 Emissions have changed by 0.0% (0.00 Gg CO2 / year). 1990-2023 Emissions have changed by 0.0% (0.00 Gg CO2 / year).
- 4: Total sectoral emissions in 2022 are 20677.41 Gg CO2 / year which is 4.3% of M.0.EL emissions. 2023 Emissions have changed by 0.0% (0.00 Gg CO2 / year). 1990-2023 Emissions have changed by 0.0% (0.00 Gg CO2 / year).
- 5: Total sectoral emissions in 2022 are 2468.28 Gg CO2 / year which is 0.5% of M.0.EL emissions. 2023 Emissions have changed by 0.0% (0.00 Gg CO2 / year). 1990-2023 Emissions have changed by 0.0% (0.00 Gg CO2 / year).
third party scenario (HISTTP):
Most important changes per time frame
For 2023 the following sector-gas combinations have the highest absolute impact on national total KyotoGHG (AR6GWP100) emissions in 2023 (top 5):
- 1: 1.A, CO2 with 5288.40 Gg CO2 / year (1.3%)
- 2: 1.A, CH4 with 0.00 Gg CO2 / year (0.0%)
- 3: 2, HFCS (AR6GWP100) with 0.00 Gg CO2 / year (0.0%)
- 4: 2, PFCS (AR6GWP100) with 0.00 Gg CO2 / year (0.0%)
- 5: M.AG.ELV, N2O with 0.00 Gg CO2 / year (0.0%)
For 1990-2023 the following sector-gas combinations have the highest absolute impact on national total KyotoGHG (AR6GWP100) emissions in 1990-2023 (top 5):
- 1: 1.A, CO2 with -23.51 Gg CO2 / year (-0.0%)
- 2: 1.A, CH4 with 0.00 Gg CO2 / year (0.0%)
- 3: 2, HFCS (AR6GWP100) with 0.00 Gg CO2 / year (0.0%)
- 4: 2, PFCS (AR6GWP100) with 0.00 Gg CO2 / year (0.0%)
- 5: M.AG.ELV, N2O with 0.00 Gg CO2 / year (0.0%)
Changes in the main sectors for aggregate KyotoGHG (AR6GWP100) are
- 1: Total sectoral emissions in 2022 are 462885.59 Gg CO2 / year which is 83.7% of M.0.EL emissions. 2023 Emissions have changed by 1.1% (5288.40 Gg CO2 / year). 1990-2023 Emissions have changed by -0.0% (-23.51 Gg CO2 / year).
- 2: Total sectoral emissions in 2022 are 33940.28 Gg CO2 / year which is 6.1% of M.0.EL emissions. 2023 Emissions have changed by 0.0% (0.00 Gg CO2 / year). 1990-2023 Emissions have changed by 0.0% (0.00 Gg CO2 / year).
- M.AG: Total sectoral emissions in 2022 are 32385.01 Gg CO2 / year which is 5.9% of M.0.EL emissions. 2023 Emissions have changed by 0.0% (0.00 Gg CO2 / year). 1990-2023 Emissions have changed by 0.0% (0.00 Gg CO2 / year).
- 4: Total sectoral emissions in 2022 are 21449.92 Gg CO2 / year which is 3.9% of M.0.EL emissions. 2023 Emissions have changed by 0.0% (0.00 Gg CO2 / year). 1990-2023 Emissions have changed by 0.0% (0.00 Gg CO2 / year).
- 5: Total sectoral emissions in 2022 are 2468.28 Gg CO2 / year which is 0.4% of M.0.EL emissions. 2023 Emissions have changed by 0.0% (0.00 Gg CO2 / year). 1990-2023 Emissions have changed by 0.0% (0.00 Gg CO2 / year).