Changes in PRIMAP-hist v2.8_final compared to v2.7_final for Mauritius
2026-09-25
Johannes Gütschow
Change analysis for Mauritius for PRIMAP-hist v2.8_final compared to v2.7_final
This changelog is published under the creative commons non-commercial share alike license. For more information see creativecommons.org.
Overview over emissions by sector and gas
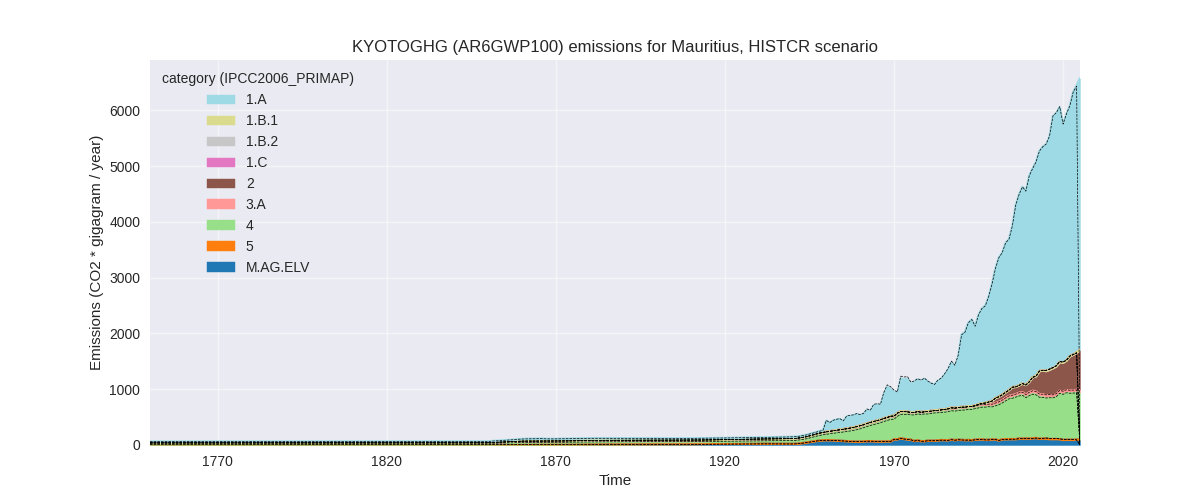
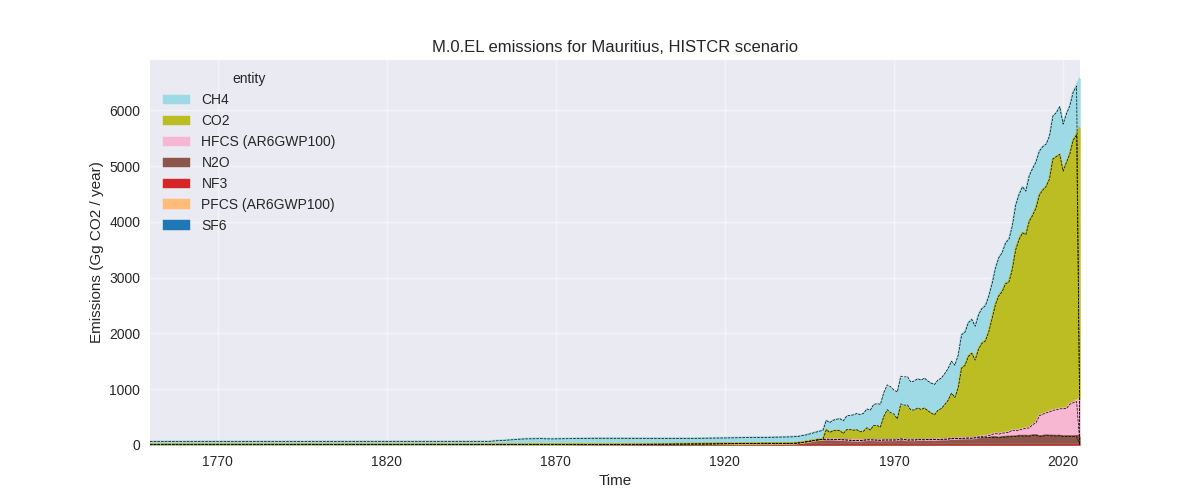
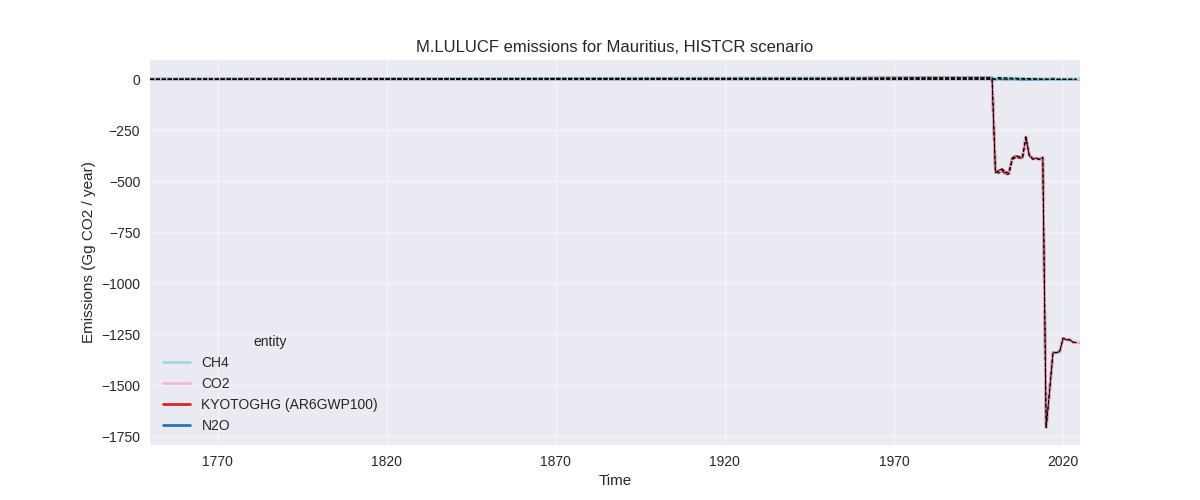
The following figures show the aggregate national total emissions excluding LULUCF AR6GWP100 for the country reported priority scenario. The dotted lines show the v2.7_final data.
The following figures show the aggregate national total emissions excluding LULUCF AR6GWP100 for the third party priority scenario. The dotted lines show the v2.7_final data.
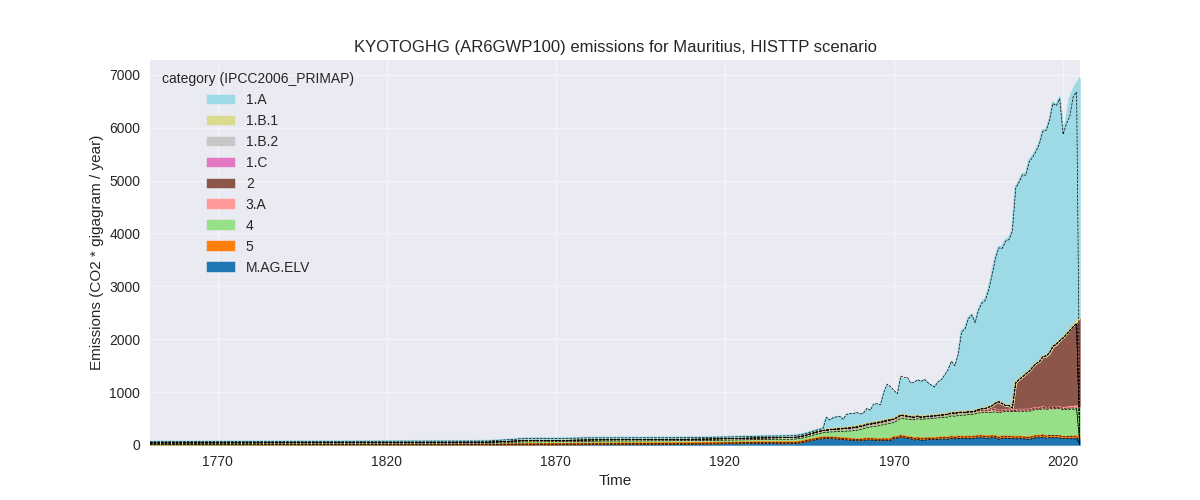
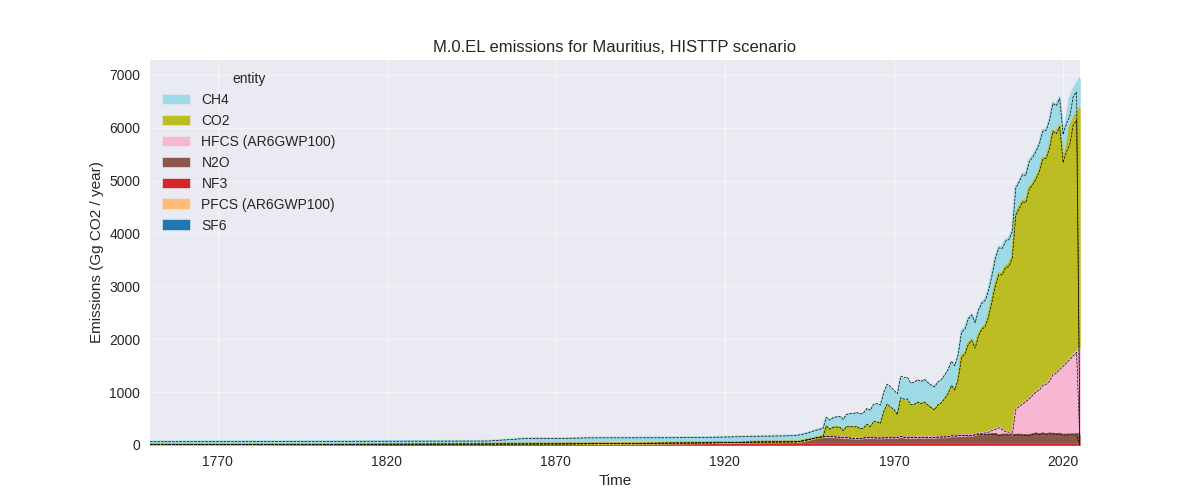
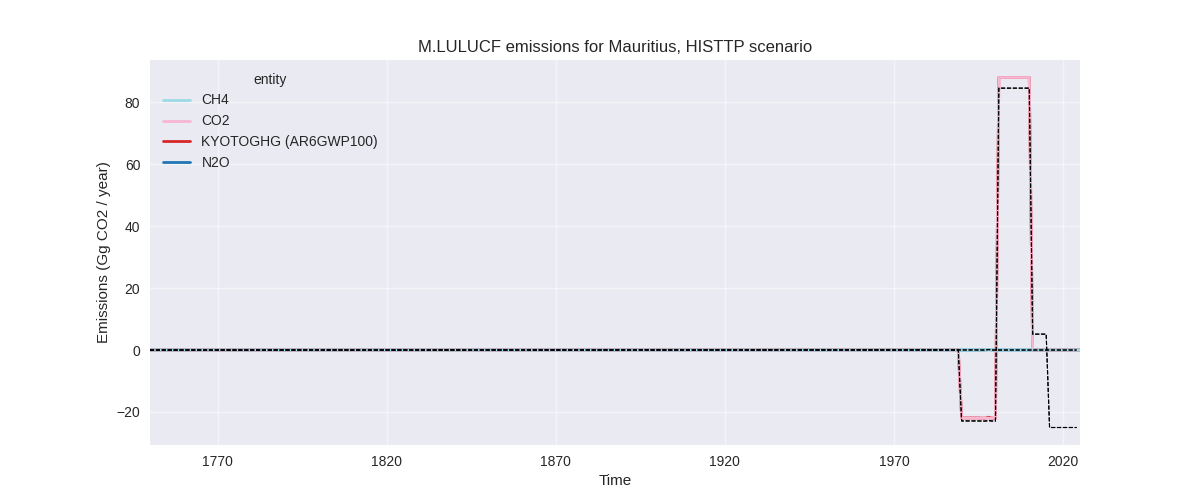
Used country reported data
The changelog with this information is available upon request for non-commercial customers. Paying commercial customers will be provided with the information.
Overview over changes
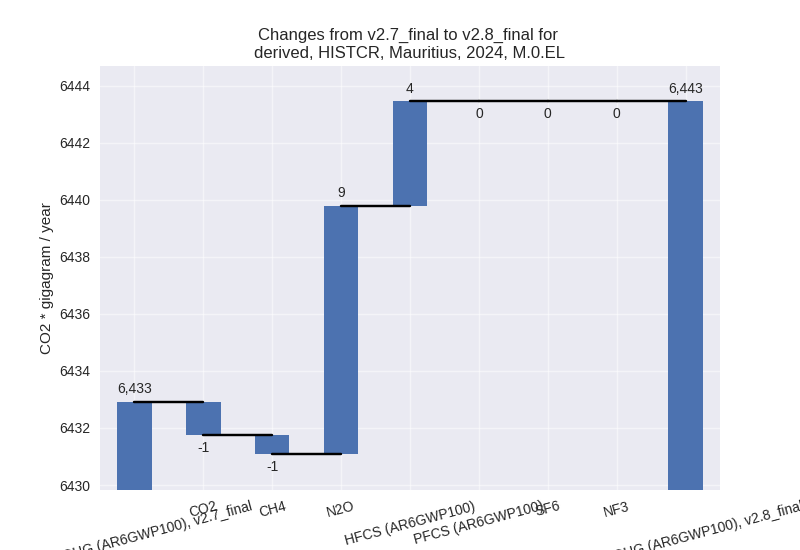
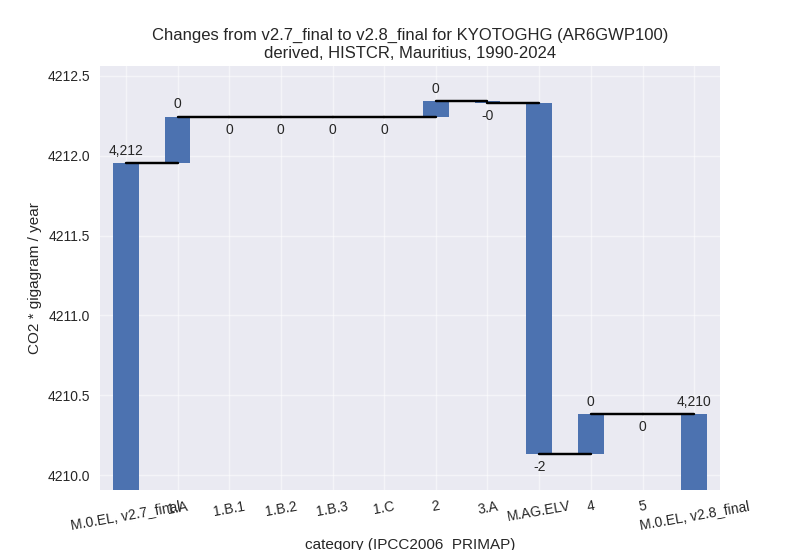
In the country reported priority scenario we have the following changes for aggregate Kyoto GHG and national total emissions excluding LULUCF (M.0.EL):
- Emissions in 2024 have changed by 0.2%% (10.53 Gg CO2 / year)
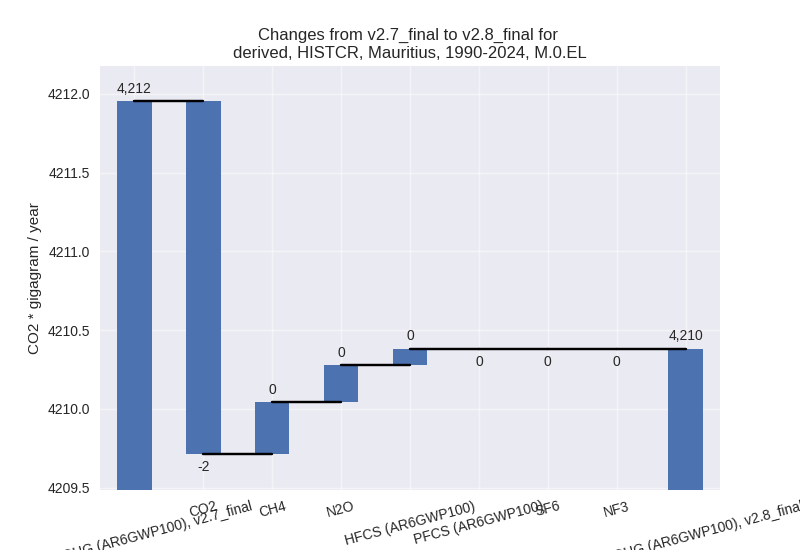
- Emissions in 1990-2024 have changed by -0.0%% (-1.57 Gg CO2 / year)
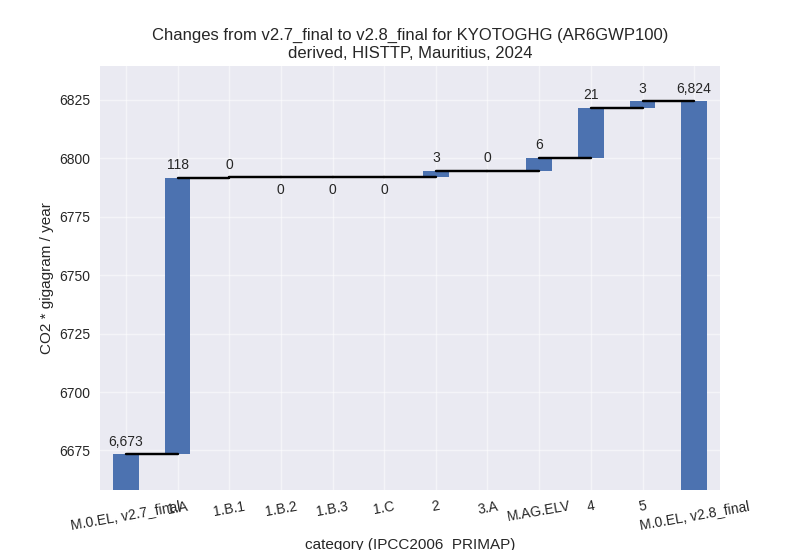
In the third party priority scenario we have the following changes for aggregate Kyoto GHG and national total emissions excluding LULUCF (M.0.EL):
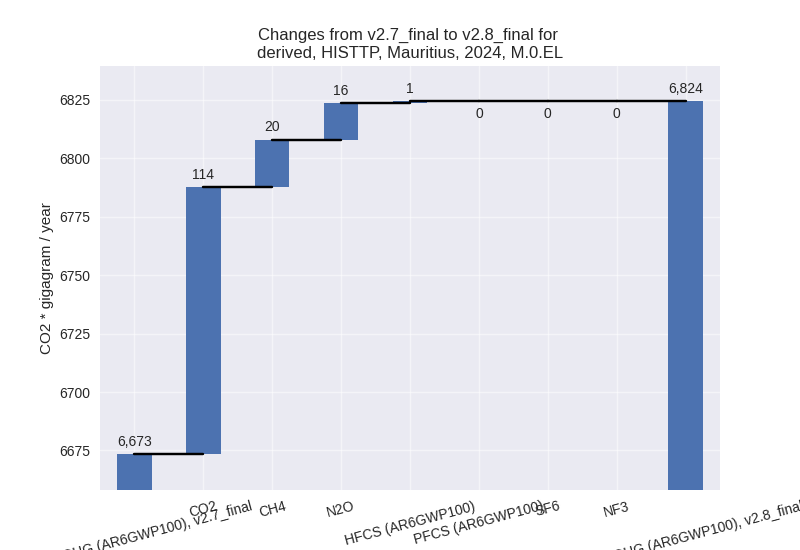
- Emissions in 2024 have changed by 2.3%% (151.01 Gg CO2 / year)
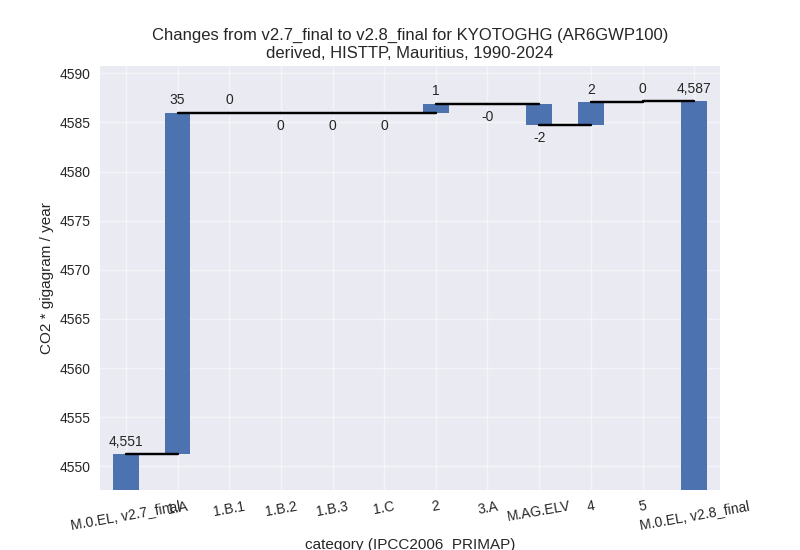
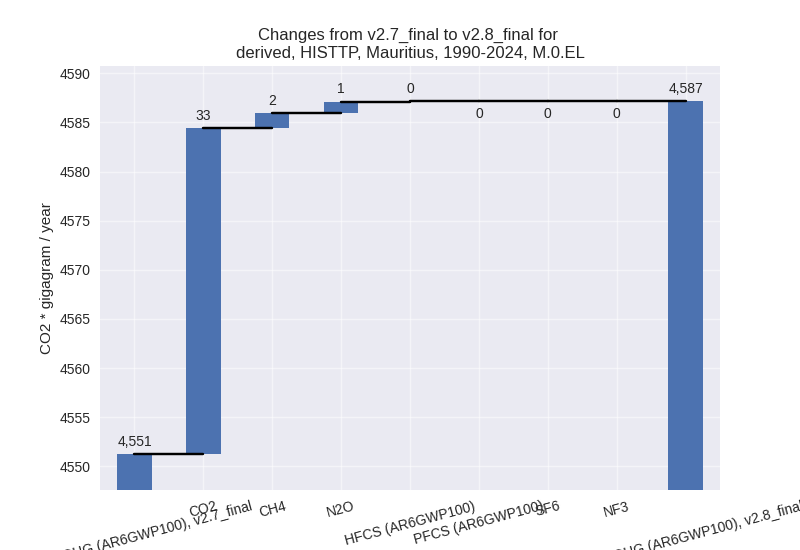
- Emissions in 1990-2024 have changed by 0.8%% (35.93 Gg CO2 / year)
Most important changes per scenario and time frame
In the country reported priority scenario the following sector-gas combinations have the highest absolute impact on national total KyotoGHG (AR6GWP100) emissions in 2024 (up to 10 with either at least 0.2% impact on total emissions or at least 20% change):
In the country reported priority scenario the following sector-gas combinations have the highest absolute impact on national total KyotoGHG (AR6GWP100) emissions in 1990-2024 (up to 10 with either at least 0.1% impact on total emissions or at least 10% change):
- 1: M.AG.ELV, CO2 with -2.30 Gg CO2 / year (-16.3%, -0.1%)
In the third party priority scenario the following sector-gas combinations have the highest absolute impact on national total KyotoGHG (AR6GWP100) emissions in 2024 (up to 10 with either at least 0.2% impact on total emissions or at least 20% change):
- 1: 1.A, CO2 with 113.42 Gg CO2 / year (2.6%, 1.7%)
- 2: 4, CH4 with 18.08 Gg CO2 / year (3.6%, 0.3%)
In the third party priority scenario the following sector-gas combinations have the highest absolute impact on national total KyotoGHG (AR6GWP100) emissions in 1990-2024 (up to 10 with either at least 0.1% impact on total emissions or at least 10% change):
- 1: 1.A, CO2 with 34.59 Gg CO2 / year (1.1%, 0.8%)
- 2: M.AG.ELV, CO2 with -2.30 Gg CO2 / year (-16.3%, -0.1%)
Notes on data changes
The changelog with this information is available upon request for non-commercial customers. Paying commercial customers will be provided with the information.
Changes by sector and gas
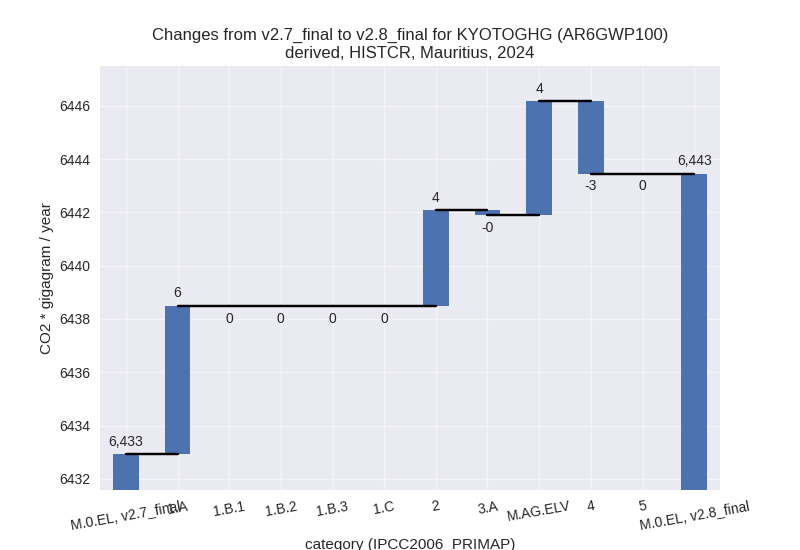
For each scenario and time frame the changes are displayed for all individual sectors and all individual gases. In the sector plot we use aggregate Kyoto GHGs in AR6GWP100. In the gas plot we usenational total emissions without LULUCF.
country reported scenario
2024
1990-2024
third party scenario
2024
1990-2024
Detailed changes for the scenarios:
country reported scenario (HISTCR):
Most important changes per time frame
For 2024 the following sector-gas combinations have the highest absolute impact on national total KyotoGHG (AR6GWP100) emissions in 2024 (up to 20 with either at least 0.2% impact on total emissions or at least 20% change):
For 1990-2024 the following sector-gas combinations have the highest absolute impact on national total KyotoGHG (AR6GWP100) emissions in 1990-2024 (up to 20 with either at least 0.1% impact on total emissions or at least 10% change):
- 1: M.AG.ELV, CO2 with -2.30 Gg CO2 / year (-16.3%), -0.1%)
Changes in the main sectors for aggregate KyotoGHG (AR6GWP100) are
- 1: Total sectoral emissions in 2022 are 4486.57 Gg CO2 / year which is 73.8% of M.0.EL emissions. 2024 Emissions have changed by 0.1% (5.57 Gg CO2 / year). 1990-2024 Emissions have changed by 0.0% (0.29 Gg CO2 / year).
- 2: Total sectoral emissions in 2022 are 613.26 Gg CO2 / year which is 10.1% of M.0.EL emissions. 2024 Emissions have changed by 0.5% (3.57 Gg CO2 / year). 1990-2024 Emissions have changed by 0.0% (0.10 Gg CO2 / year).
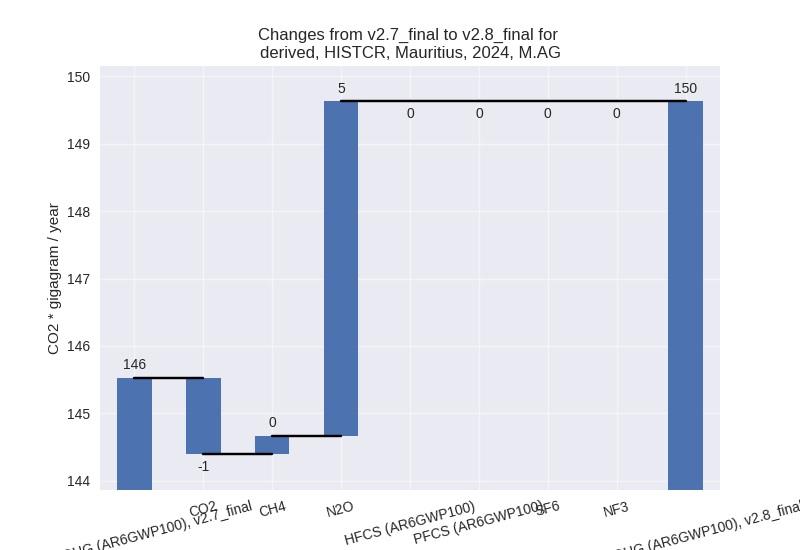
- M.AG: Total sectoral emissions in 2022 are 146.84
Gg CO2 / year which is 2.4% of M.0.EL emissions. 2024 Emissions have
changed by 2.8% (4.10 Gg CO2 /
year). 1990-2024 Emissions have changed by -1.4% (-2.21 Gg CO2 / year). For 2024 the
changes per gas
are:
The changes come from the following subsectors:- 3.A: Total sectoral emissions in 2022 are 53.20 Gg CO2 / year which is 36.2% of category M.AG emissions. 2024 Emissions have changed by -0.3% (-0.16 Gg CO2 / year). 1990-2024 Emissions have changed by -0.0% (-0.01 Gg CO2 / year).
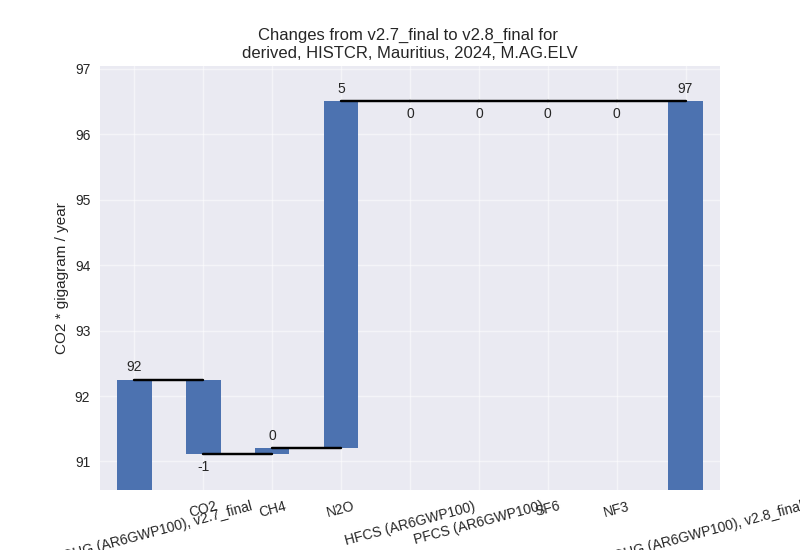
- M.AG.ELV: Total sectoral emissions in 2022 are
93.64 Gg CO2 / year which is 63.8% of category M.AG emissions. 2024
Emissions have changed by 4.6% (4.26
Gg CO2 / year). 1990-2024 Emissions have changed by -2.1% (-2.20 Gg CO2 / year). For 2024 the
changes per gas
are:
For 1990-2024 the changes per gas are: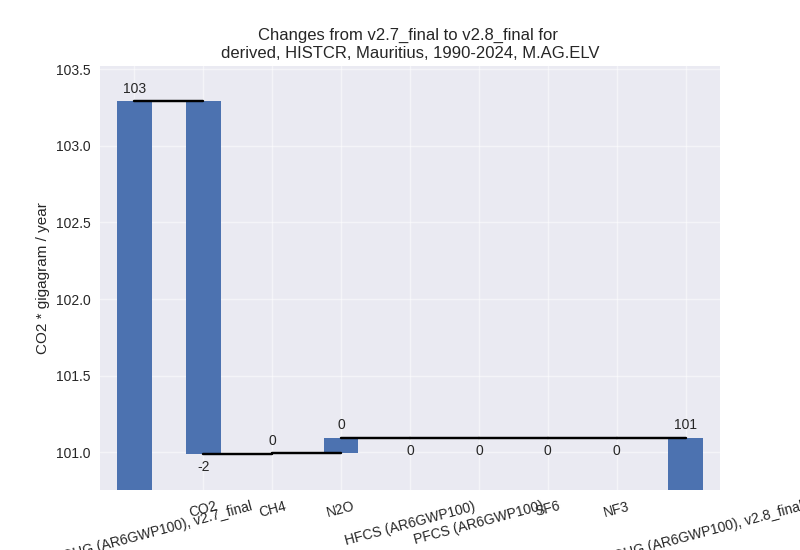
There is no subsector information available in PRIMAP-hist.
- 4: Total sectoral emissions in 2022 are 829.77 Gg CO2 / year which is 13.7% of M.0.EL emissions. 2024 Emissions have changed by -0.3% (-2.71 Gg CO2 / year). 1990-2024 Emissions have changed by 0.0% (0.25 Gg CO2 / year).
- 5: No data
third party scenario (HISTTP):
Most important changes per time frame
For 2024 the following sector-gas combinations have the highest absolute impact on national total KyotoGHG (AR6GWP100) emissions in 2024 (up to 20 with either at least 0.2% impact on total emissions or at least 20% change):
- 1: 1.A, CO2 with 113.42 Gg CO2 / year (2.6%), 1.7%)
- 2: 4, CH4 with 18.08 Gg CO2 / year (3.6%), 0.3%)
For 1990-2024 the following sector-gas combinations have the highest absolute impact on national total KyotoGHG (AR6GWP100) emissions in 1990-2024 (up to 20 with either at least 0.1% impact on total emissions or at least 10% change):
- 1: 1.A, CO2 with 34.59 Gg CO2 / year (1.1%), 0.8%)
- 2: M.AG.ELV, CO2 with -2.30 Gg CO2 / year (-16.3%), -0.1%)
Changes in the main sectors for aggregate KyotoGHG (AR6GWP100) are
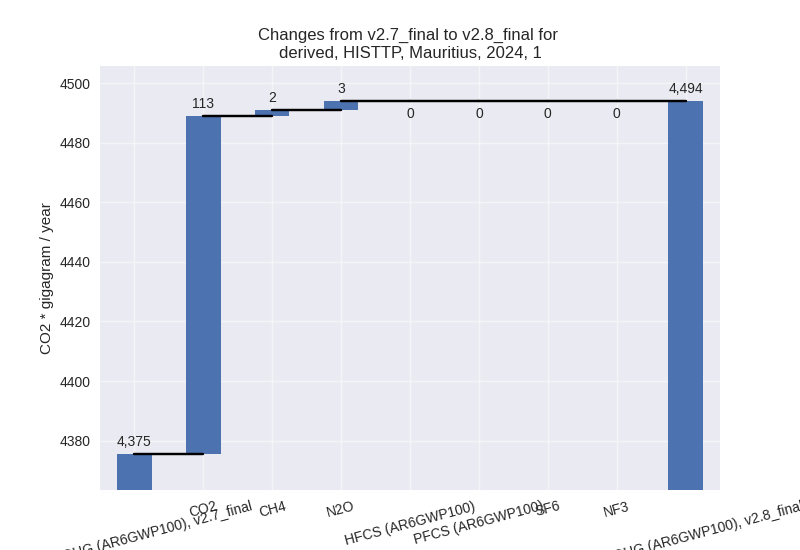
- 1: Total sectoral emissions in 2022 are 4365.96 Gg
CO2 / year which is 66.7% of M.0.EL emissions. 2024 Emissions have
changed by 2.7% (118.41 Gg CO2 /
year). 1990-2024 Emissions have changed by 1.1% (34.77 Gg CO2 / year). For 2024 the
changes per gas
are:
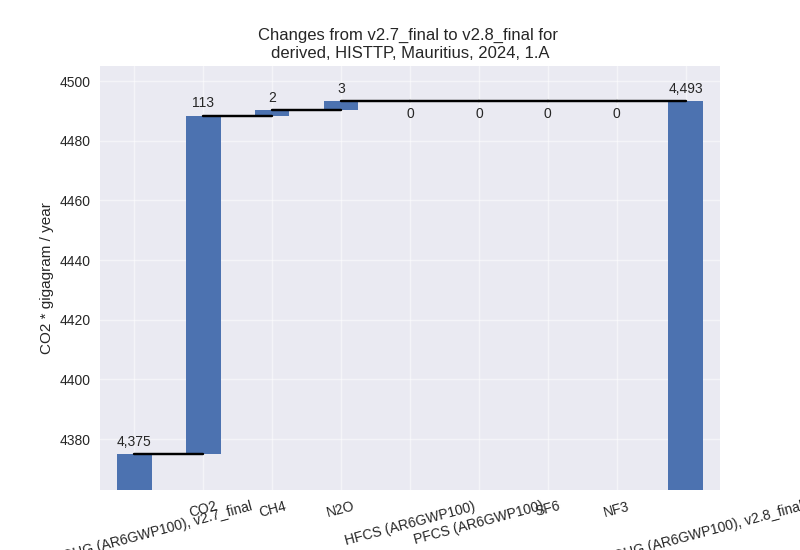
The changes come from the following subsectors:- 1.A: Total sectoral emissions in 2022 are 4365.24
Gg CO2 / year which is 100.0% of category 1 emissions. 2024 Emissions
have changed by 2.7% (118.31 Gg CO2
/ year). 1990-2024 Emissions have changed by 1.1% (34.77 Gg CO2 / year). For 2024 the
changes per gas
are:
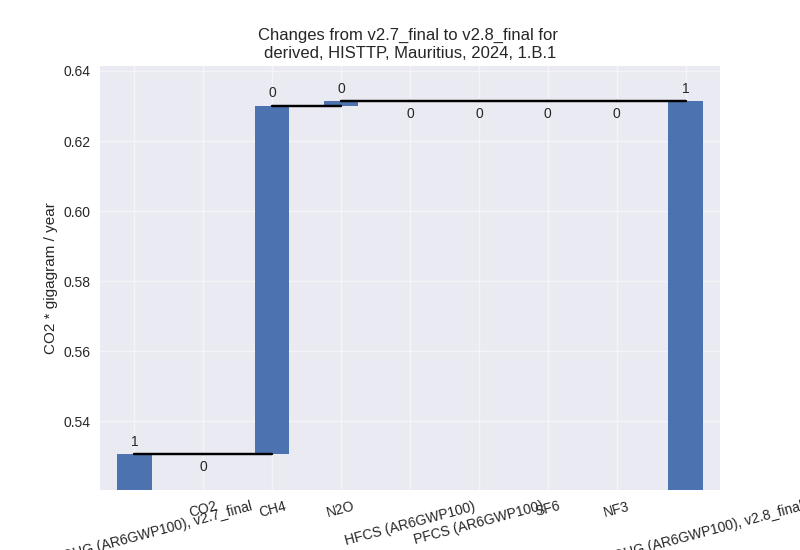
There is no subsector information available in PRIMAP-hist. - 1.B.1: Total sectoral emissions in 2022 are 0.71 Gg
CO2 / year which is 0.0% of category 1 emissions. 2024 Emissions have
changed by 19.0% (0.10 Gg CO2 /
year). 1990-2024 Emissions have changed by 0.0% (0.00 Gg CO2 / year). For 2024 the
changes per gas
are:
There is no subsector information available in PRIMAP-hist.
- 1.A: Total sectoral emissions in 2022 are 4365.24
Gg CO2 / year which is 100.0% of category 1 emissions. 2024 Emissions
have changed by 2.7% (118.31 Gg CO2
/ year). 1990-2024 Emissions have changed by 1.1% (34.77 Gg CO2 / year). For 2024 the
changes per gas
are:
- 2: Total sectoral emissions in 2022 are 1468.52 Gg CO2 / year which is 22.4% of M.0.EL emissions. 2024 Emissions have changed by 0.2% (2.81 Gg CO2 / year). 1990-2024 Emissions have changed by 0.2% (0.91 Gg CO2 / year).
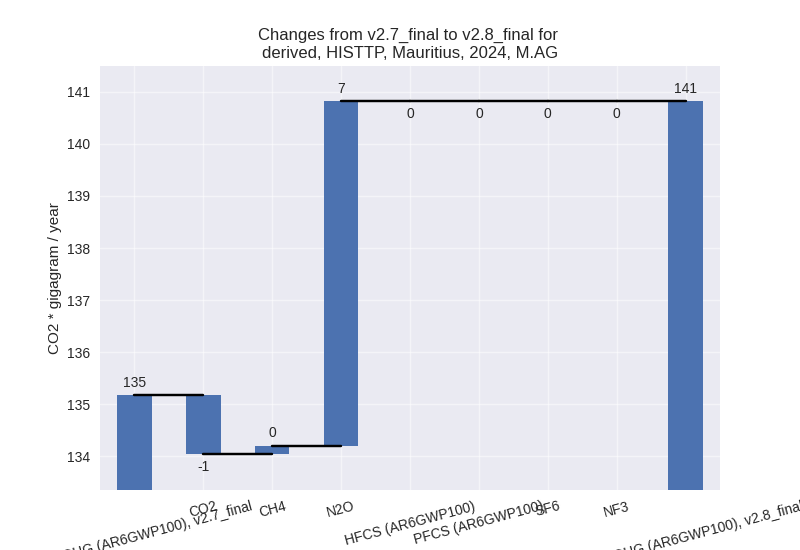
- M.AG: Total sectoral emissions in 2022 are 137.48
Gg CO2 / year which is 2.1% of M.0.EL emissions. 2024 Emissions have
changed by 4.2% (5.64 Gg CO2 /
year). 1990-2024 Emissions have changed by -1.4% (-2.17 Gg CO2 / year). For 2024 the
changes per gas
are:
The changes come from the following subsectors:- 3.A: Total sectoral emissions in 2022 are 23.94 Gg CO2 / year which is 17.4% of category M.AG emissions. 2024 Emissions have changed by 0.0% (0.01 Gg CO2 / year). 1990-2024 Emissions have changed by -0.0% (-0.00 Gg CO2 / year).
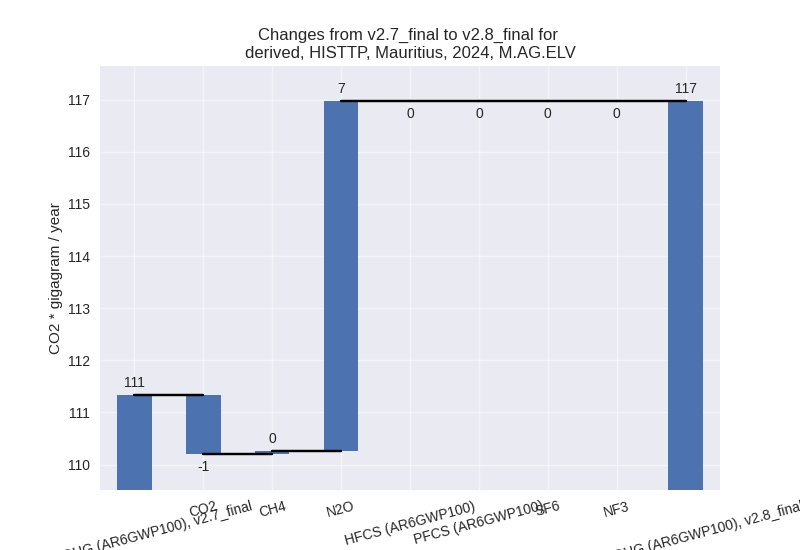
- M.AG.ELV: Total sectoral emissions in 2022 are
113.54 Gg CO2 / year which is 82.6% of category M.AG emissions. 2024
Emissions have changed by 5.1% (5.64
Gg CO2 / year). 1990-2024 Emissions have changed by -1.7% (-2.17 Gg CO2 / year). For 2024 the
changes per gas
are:
There is no subsector information available in PRIMAP-hist.
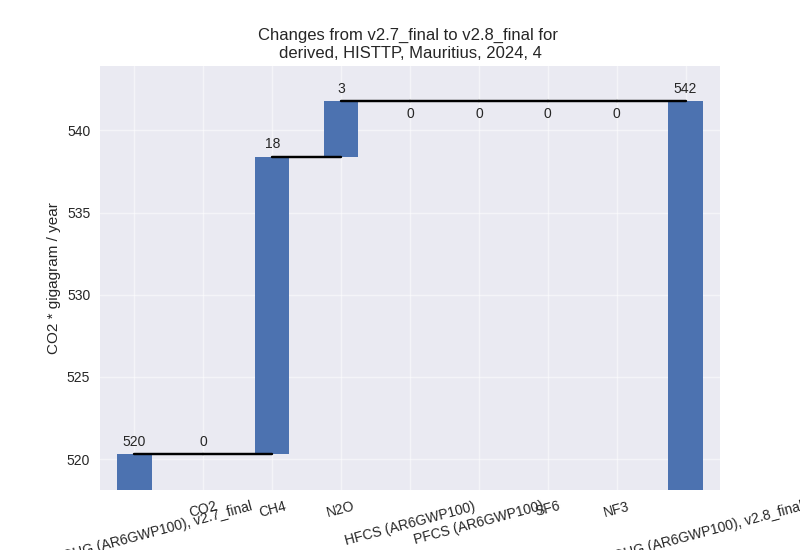
- 4: Total sectoral emissions in 2022 are 536.02 Gg
CO2 / year which is 8.2% of M.0.EL emissions. 2024 Emissions have
changed by 4.1% (21.46 Gg CO2 /
year). 1990-2024 Emissions have changed by 0.5% (2.30 Gg CO2 / year). For 2024 the
changes per gas
are:
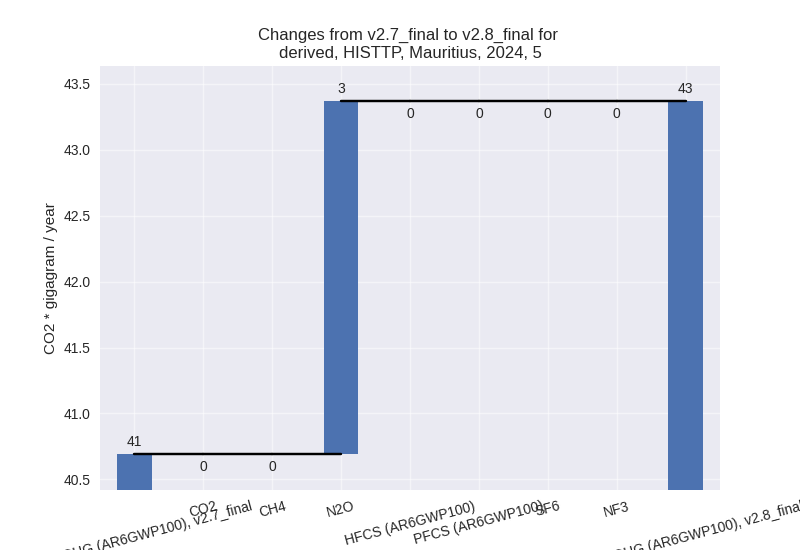
- 5: Total sectoral emissions in 2022 are 40.61 Gg
CO2 / year which is 0.6% of M.0.EL emissions. 2024 Emissions have
changed by 6.6% (2.68 Gg CO2 /
year). 1990-2024 Emissions have changed by 0.3% (0.11 Gg CO2 / year). For 2024 the
changes per gas
are: